
The State of U.S. Clinical Trials: 2026 Landscape Intelligence
Last updated: Nov 8, 2026
Heart Disease Kills the Most Americans. Cancer Gets Nearly Three Times the Trials.
The State of U.S. Clinical Trials: 2026 Landscape Intelligence
We analyzed all 196,827 studies on ClinicalTrials.gov with at least one U.S. site. U.S. clinical research is concentrated in cancer, led by academic medical centers, and stalls most often in Phase 2. Children are eligible for one recruiting study in six. After four straight years of decline, study starts are rising again in 2026.
Key Numbers
Where U.S. clinical research is concentrated
| Metric | Result |
|---|---|
| Recruiting interventional studies in oncology vs. cardiovascular | 2.9× (4,921 vs. 1,677) |
| Recruiting studies led by academic centers, hospitals and nonprofits | 71.0% (15,650 of 22,051) |
| Oncology Phase 2 studies for every Phase 3 study | 4.9 (all studies: 2.1) |
| U.S. study starts, Jan 1–Nov 6, 2026 vs. the same dates in 2025 | +3.3% (8,304 vs. 8,041) |
Where the gaps are
| Metric | Result |
|---|---|
| Phase 2 studies that ended in early termination | 21.6% (all studies: 14.5%) |
| Recruiting interventional studies that accept children | 16.5% (2,940 of 17,809) |
| Recruiting cardiovascular studies that accept children | 8.7% |
| Terminated studies that cite slow enrollment | at least 30.3% (6,238 of 20,593) |
| U.S. study starts led by NIH, 2010 vs. 2025 | −63.5% (356 vs. 130) |
Measured against the death toll, heart disease has 2.5 recruiting studies per 1,000 deaths. Cancer has 7.9.
The Short Version
ClinicalTrials.gov is the U.S. government’s public registry of clinical studies. Every study that tests a drug, device or behavior in people, and many that only observe them, is listed there with its phase, sponsor, status, conditions and eligibility. Taken together, it is the most complete public record of where American medical research is headed.
That record is lopsided. Cancer leads every other therapeutic area by a wide margin, with 1.8 times as many recruiting studies as neurology, the next largest. Most research is led not by drug companies but by academic medical centers and hospitals, which run 71% of studies recruiting today. And the system loses the most studies in the middle: Phase 2, where a promising idea first has to show it works, ends early more often than any other phase.
Of the 196,827 U.S.-linked studies, 61.7% are completed and 22,051 (11.2%) are recruiting now.
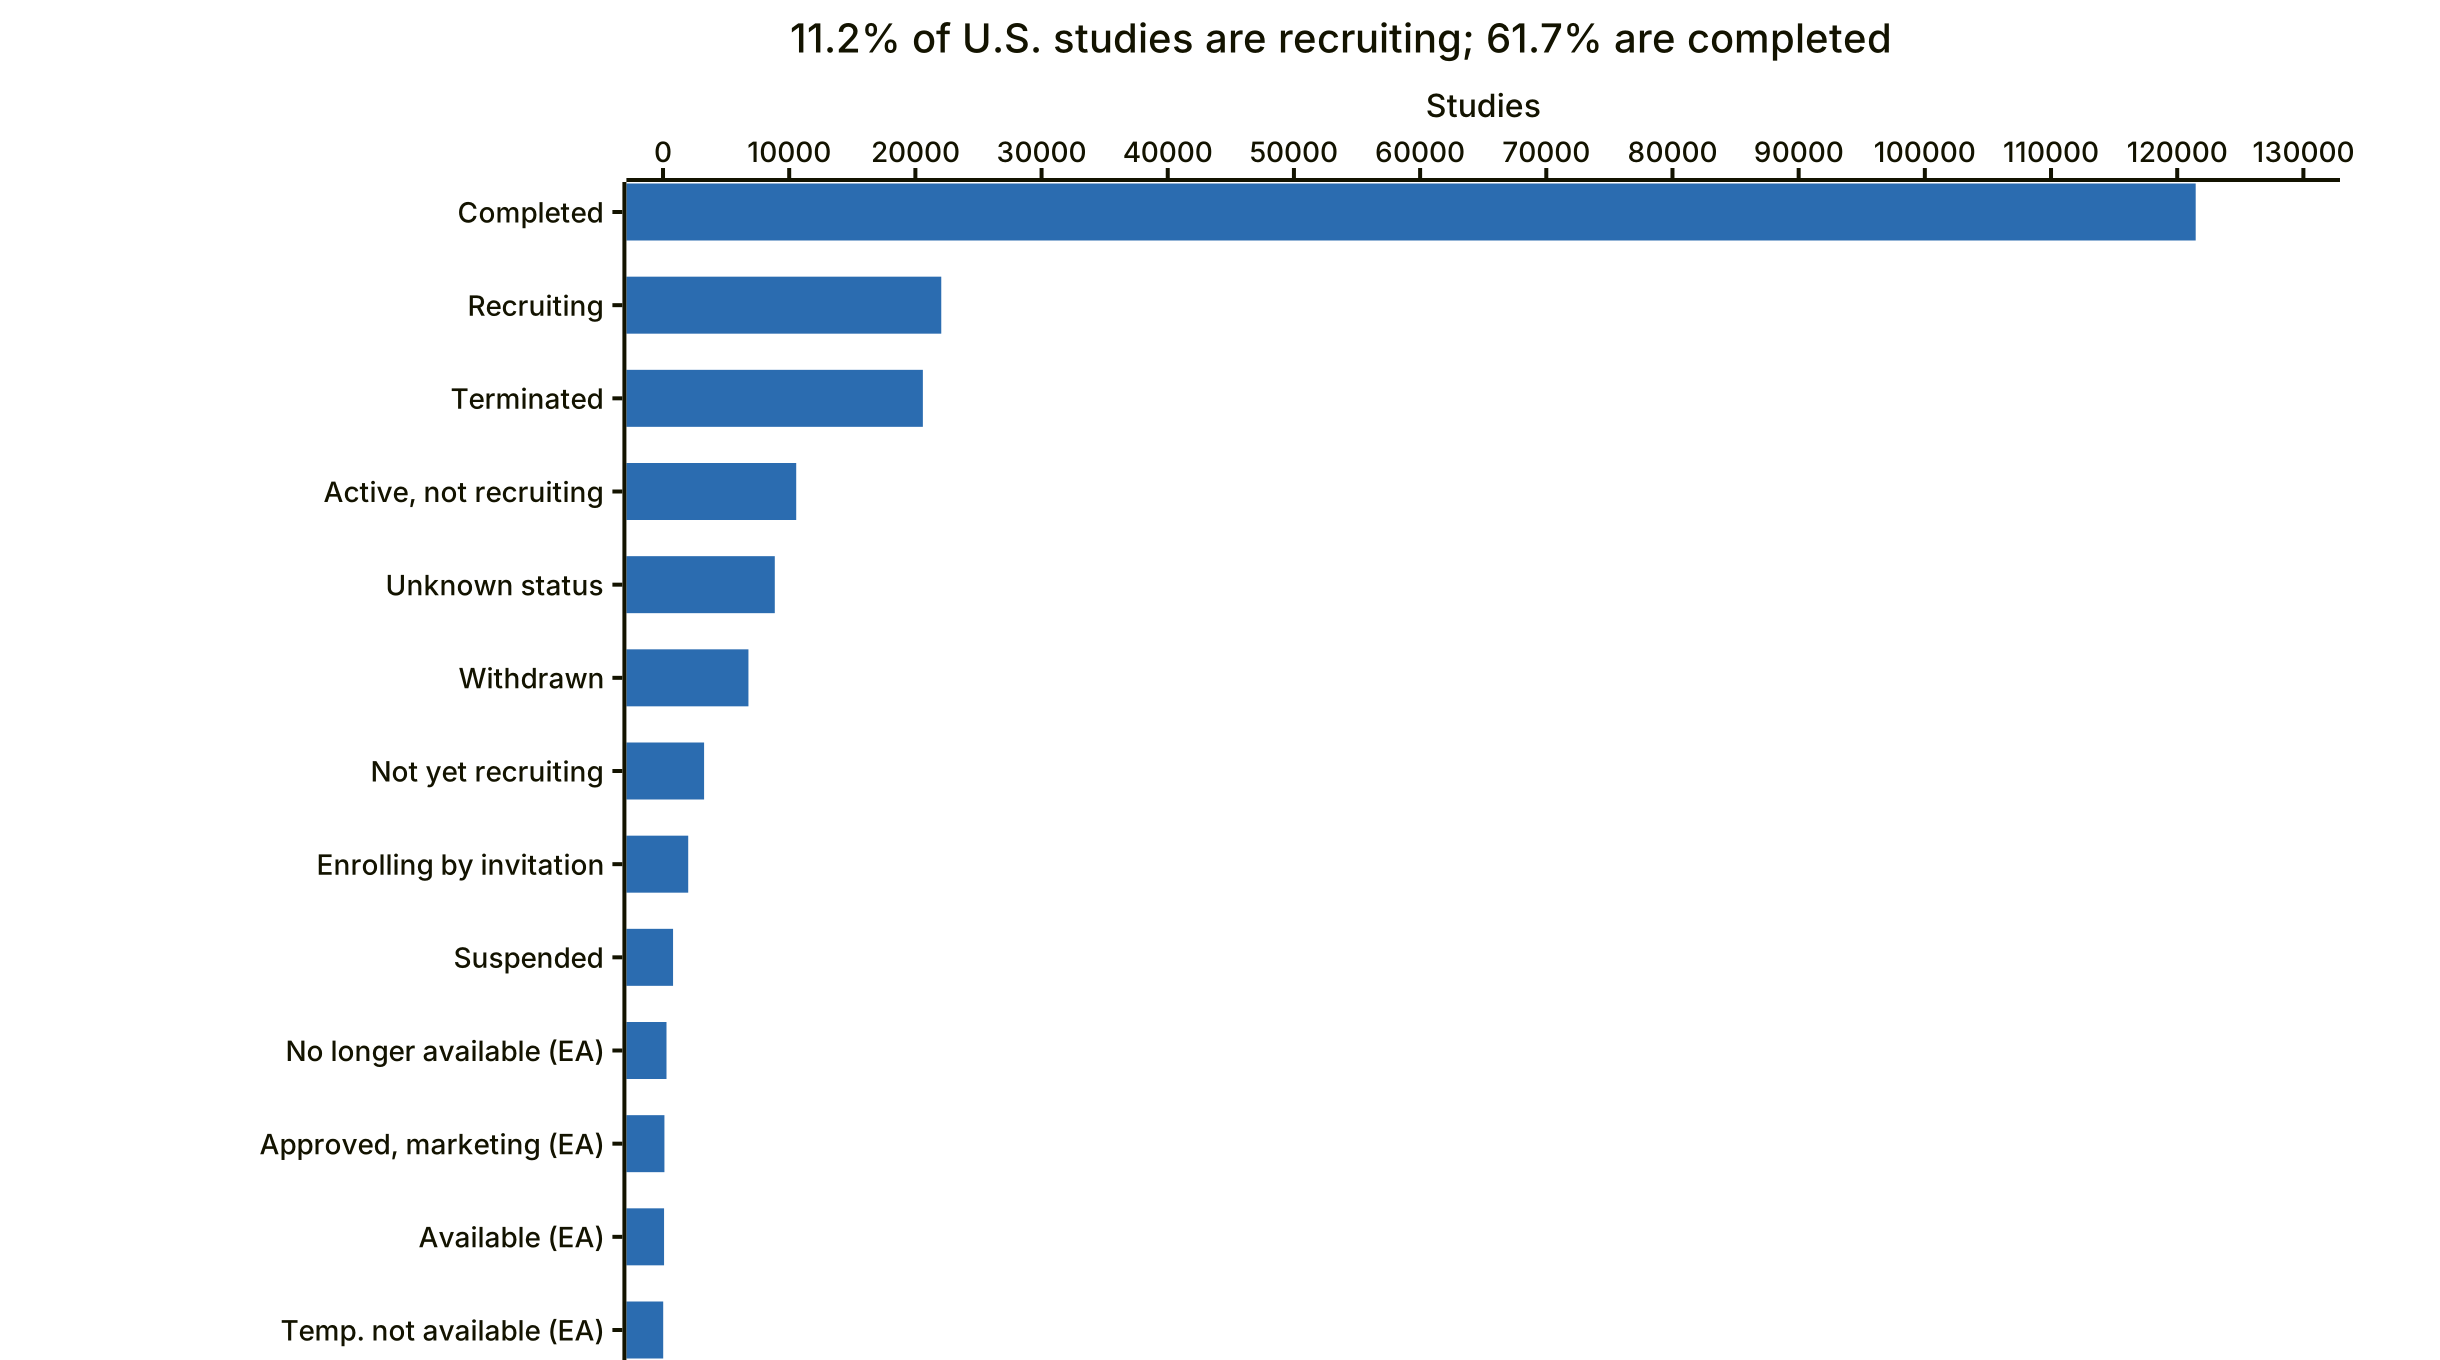
U.S.-linked studies by registry status. EA = expanded-access programs, which are not trials. Source: ClinicalTrials.gov, data as of Nov 6, 2026.
Why now. 2026 is the first year since 2021 in which U.S. study starts are up on the year before. 8,304 studies started between Jan 1 and Nov 6, 2026, 3.3% more than over the same dates in 2025. The four years before each fell. This report is the baseline for that turn.
Three Questions, Answered
1. Where is U.S. clinical research concentrated?
In cancer, in academic medical centers, and in Phase 2. Oncology has 4,921 recruiting interventional studies, 2.9 times cardiovascular disease. Academic centers, hospitals and nonprofits lead 71.0% of recruiting studies, and industry leads 22.6%. Phase 2 is the largest drug-development phase, at 2.1 times Phase 3.
2. Where are the gaps?
In heart disease relative to its death toll, in research open to children, and in the step from Phase 2 to Phase 3. Cardiovascular disease has a third as many recruiting studies per death as cancer. Children are eligible for 16.5% of recruiting studies and for 8.7% of cardiovascular ones. Oncology and hematology run four to five Phase 2 studies for every Phase 3.
3. Is U.S. clinical research growing or shrinking?
Growing again, from a lower base. Starts peaked at 10,786 in 2021 and fell four years in a row. 2026 is running 3.3% ahead of 2025, but still 12.1% below the same period of 2021.
Finding 1: Cancer Dominates U.S. Clinical Research
Oncology is the largest therapeutic area by any measure. It has 4,921 recruiting interventional studies: 1.8 times neurology, 2.2 times mental health and 2.9 times cardiovascular disease.
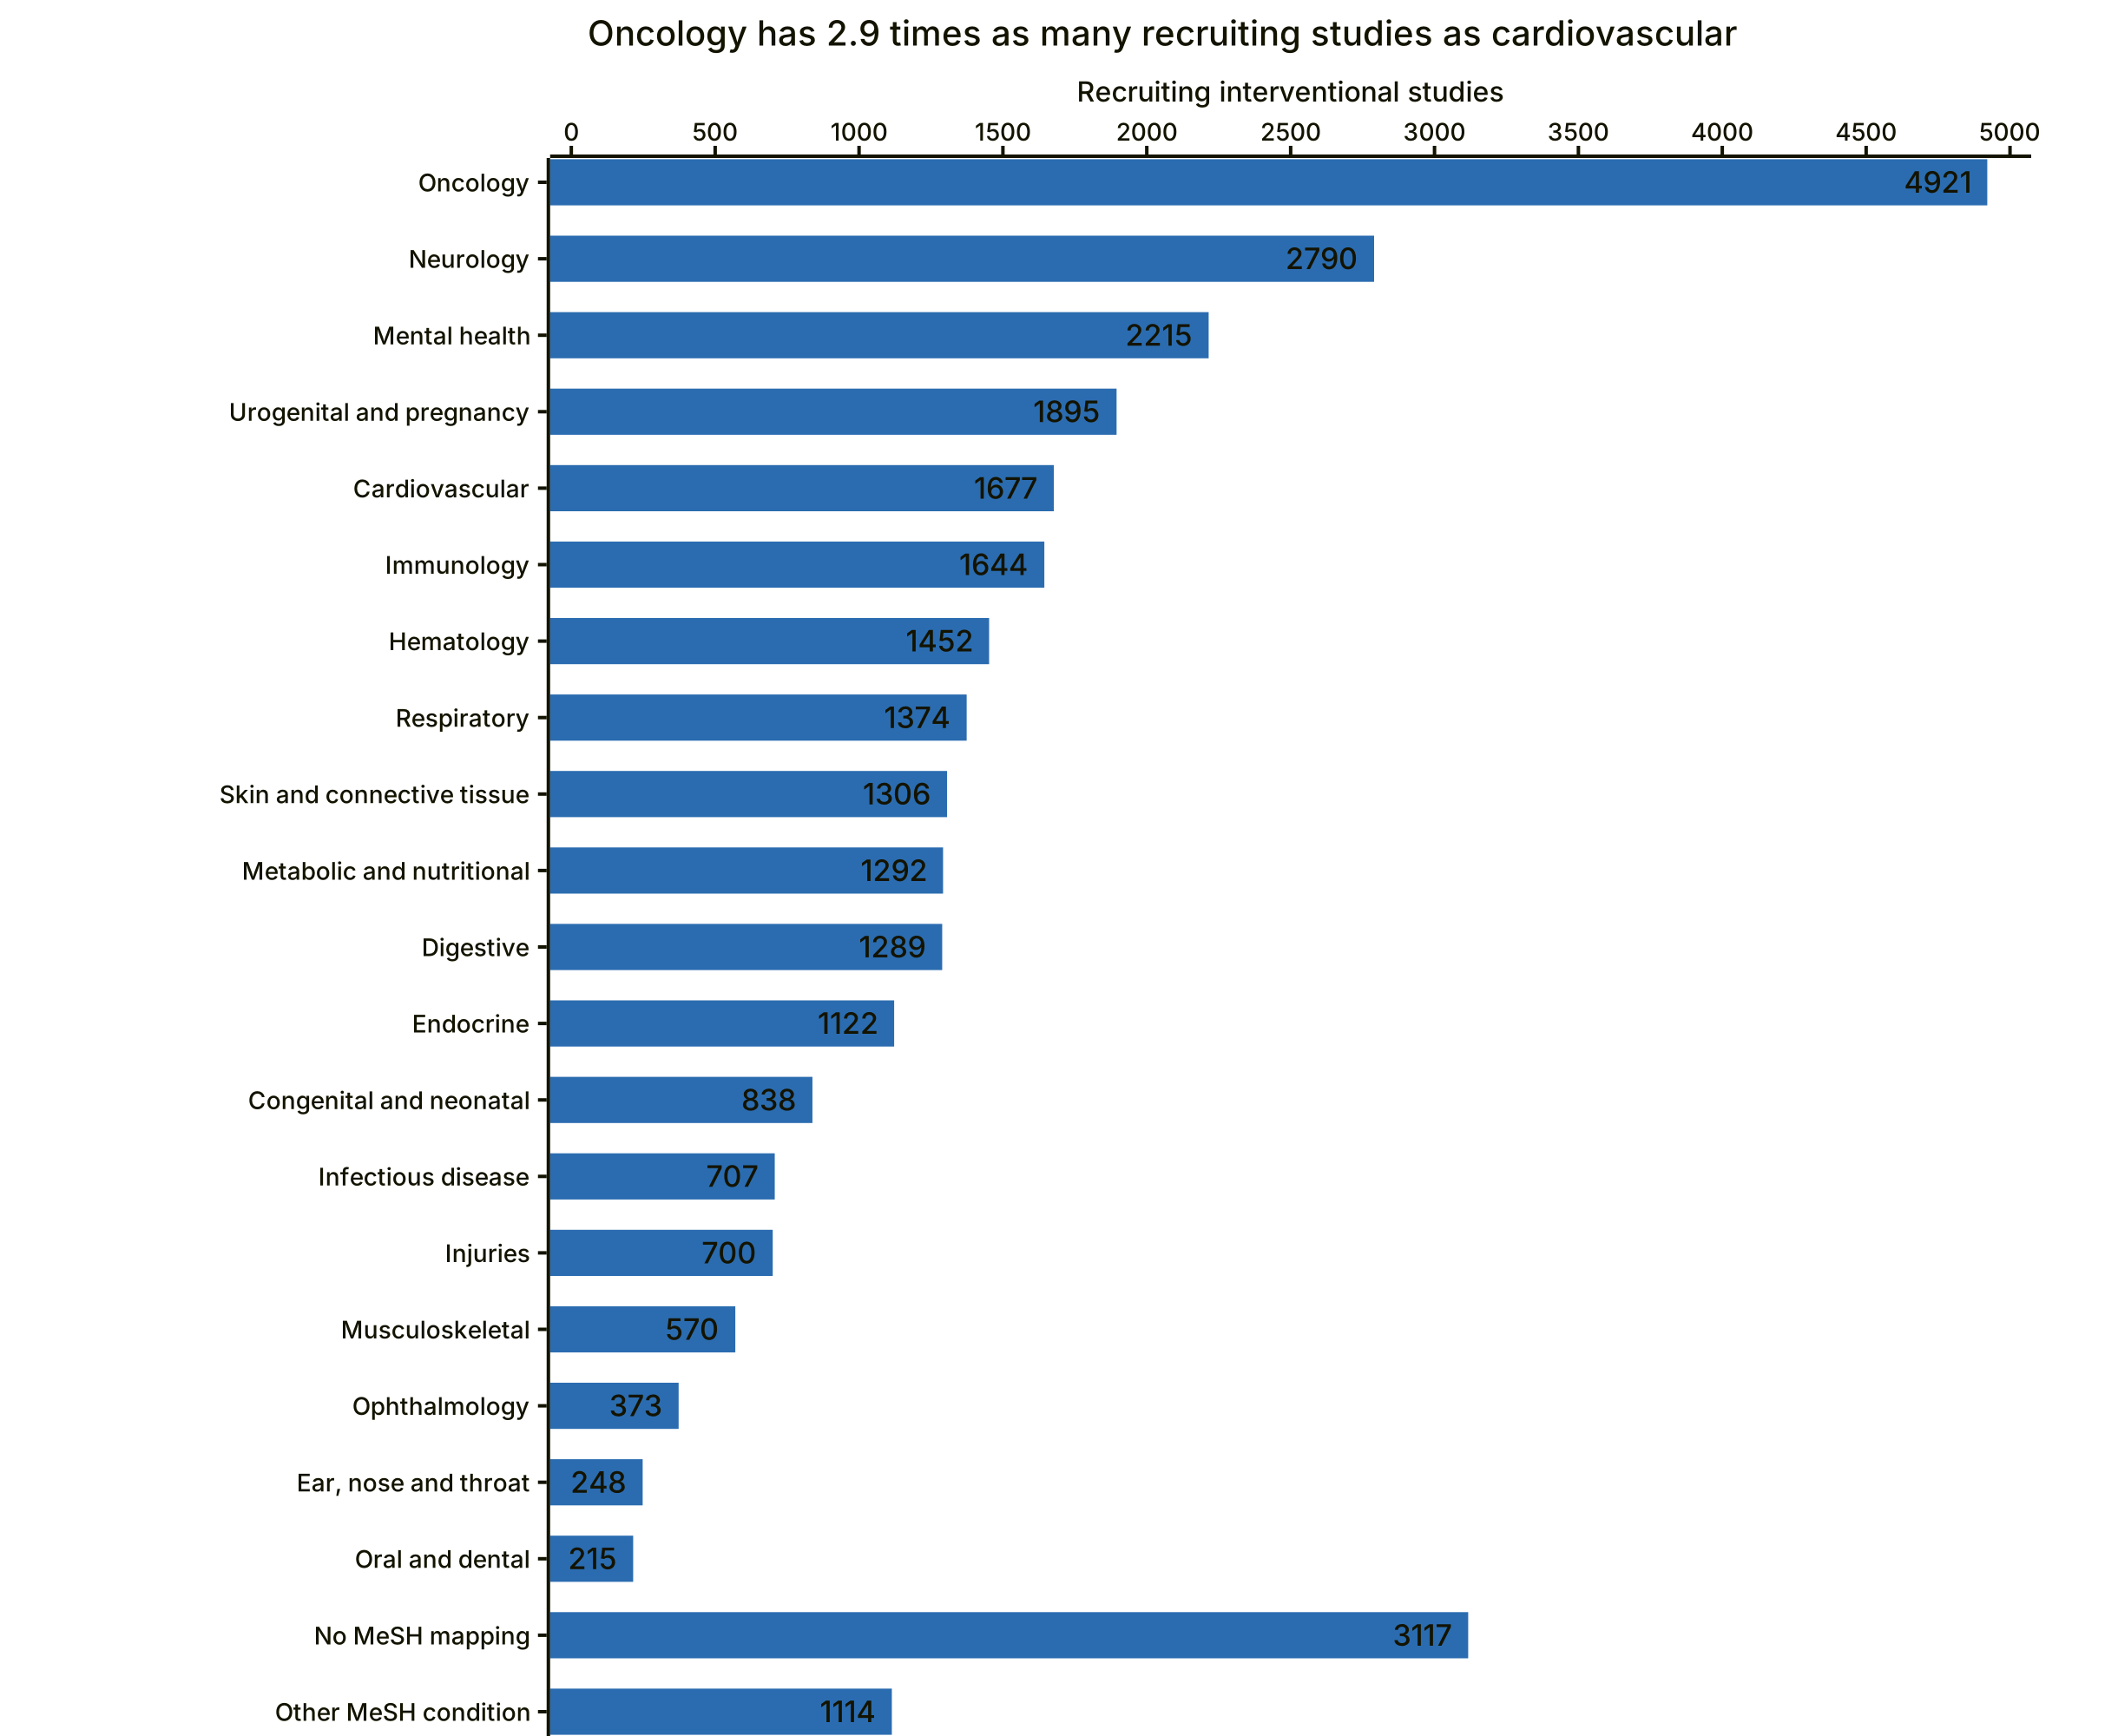
Recruiting interventional U.S.-linked studies by therapeutic area. Areas come from ClinicalTrials.gov’s own MeSH coding of each study’s conditions; a study can count in more than one area. Source: ClinicalTrials.gov, data as of Nov 6, 2026.
Areas are assigned from the Medical Subject Headings (MeSH) that ClinicalTrials.gov attaches to every study’s conditions, not from keyword searches. 76.5% of U.S.-linked studies map to at least one of 19 therapeutic areas.
Finding 2: Research Does Not Follow the Death Toll
Heart disease is the leading cause of death in the United States, ahead of cancer. Clinical research runs the other way.
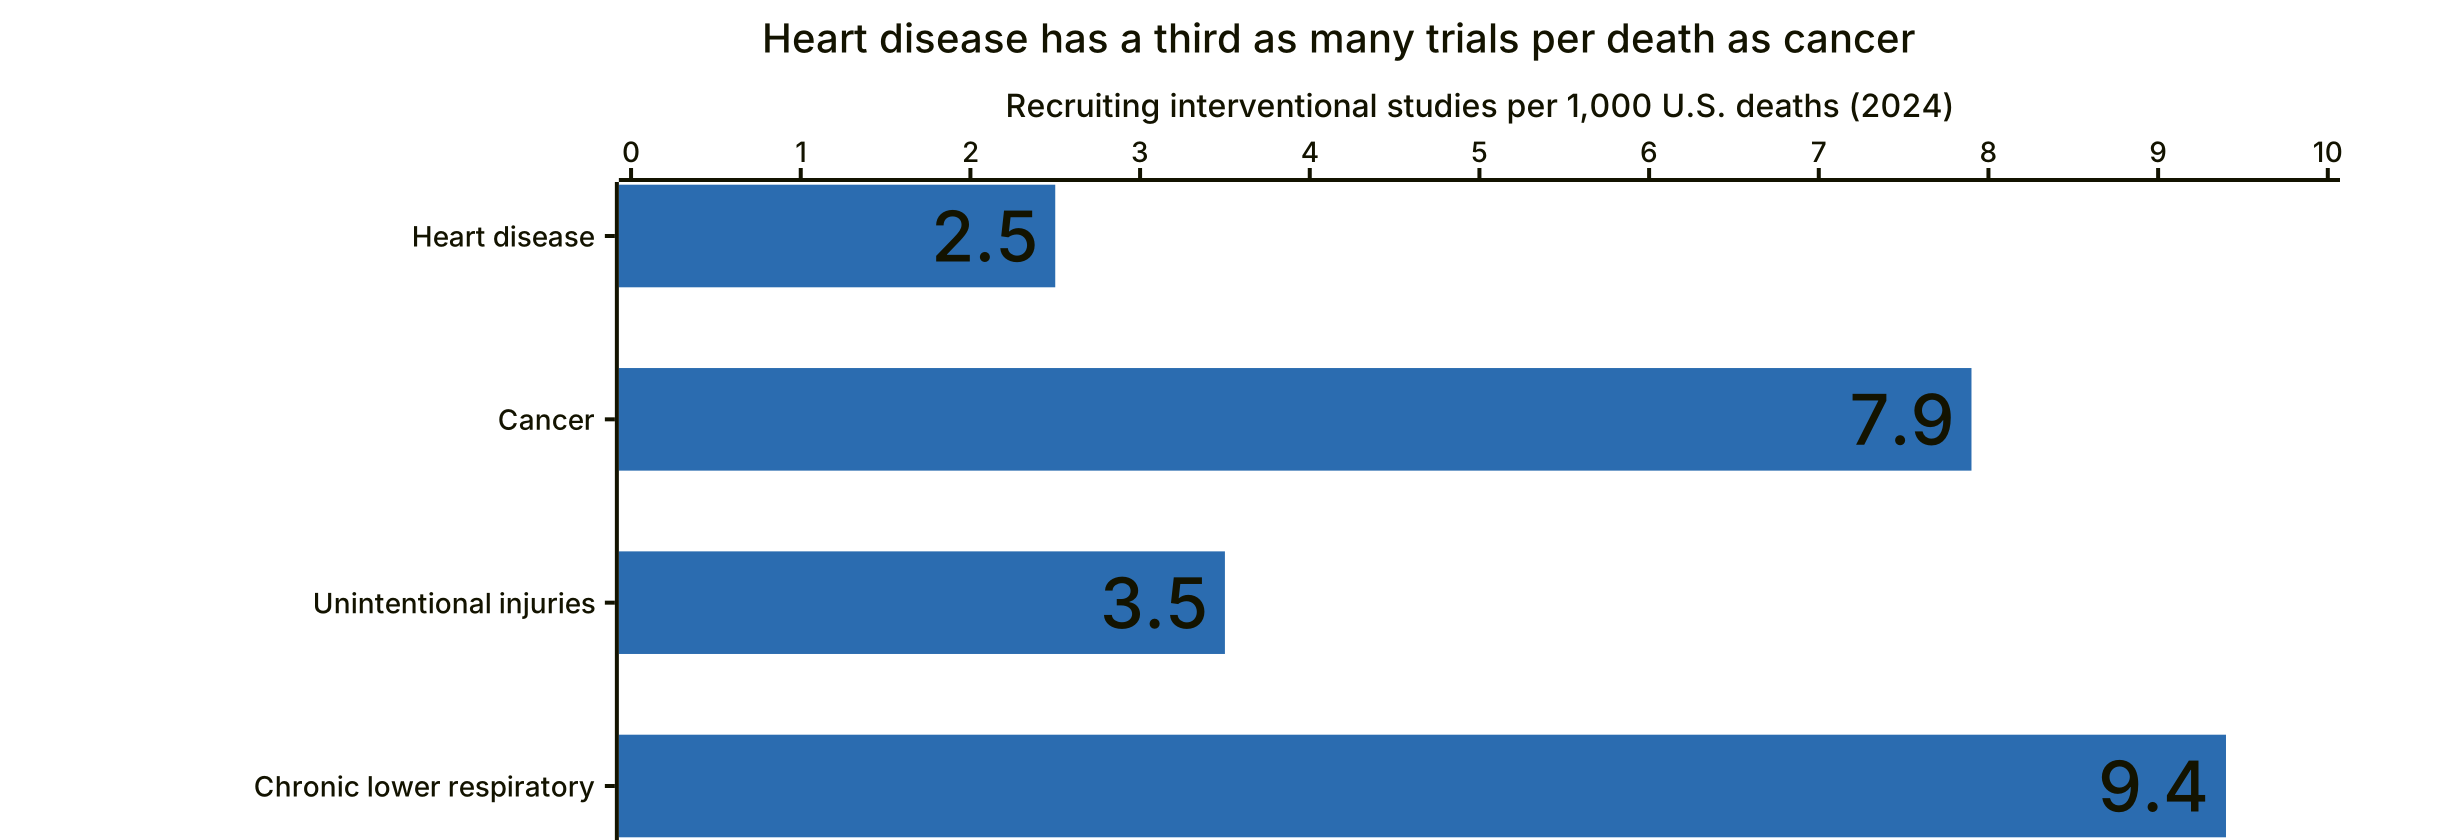
Recruiting interventional studies per 1,000 U.S. deaths in 2024. Sources: ClinicalTrials.gov, data as of Nov 6, 2026; CDC, Mortality in the United States, 2024.
| Cause of death (2024) | Deaths | Therapeutic area | Recruiting interventional studies | Per 1,000 deaths |
|---|---|---|---|---|
| Heart disease | 683,491 | Cardiovascular | 1,677 | 2.5 |
| Cancer | 619,876 | Oncology | 4,921 | 7.9 |
| Unintentional injuries | 197,449 | Injuries | 700 | 3.5 |
| Chronic lower respiratory diseases | 145,643 | Respiratory | 1,374 | 9.4 |
Read these ratios as a direction, not a precise measure. The therapeutic areas are broader than the causes of death: cardiovascular includes stroke and vascular disease, and respiratory includes asthma and infections. Overdose deaths count as unintentional injuries, but overdose studies map to other areas.
Finding 3: Phase 2 Is Where Studies Stop
21.6% of Phase 2 studies that ended were terminated early, against 14.5% across all studies. Phase 2 is the first test of whether a treatment works, and the largest phase by volume.
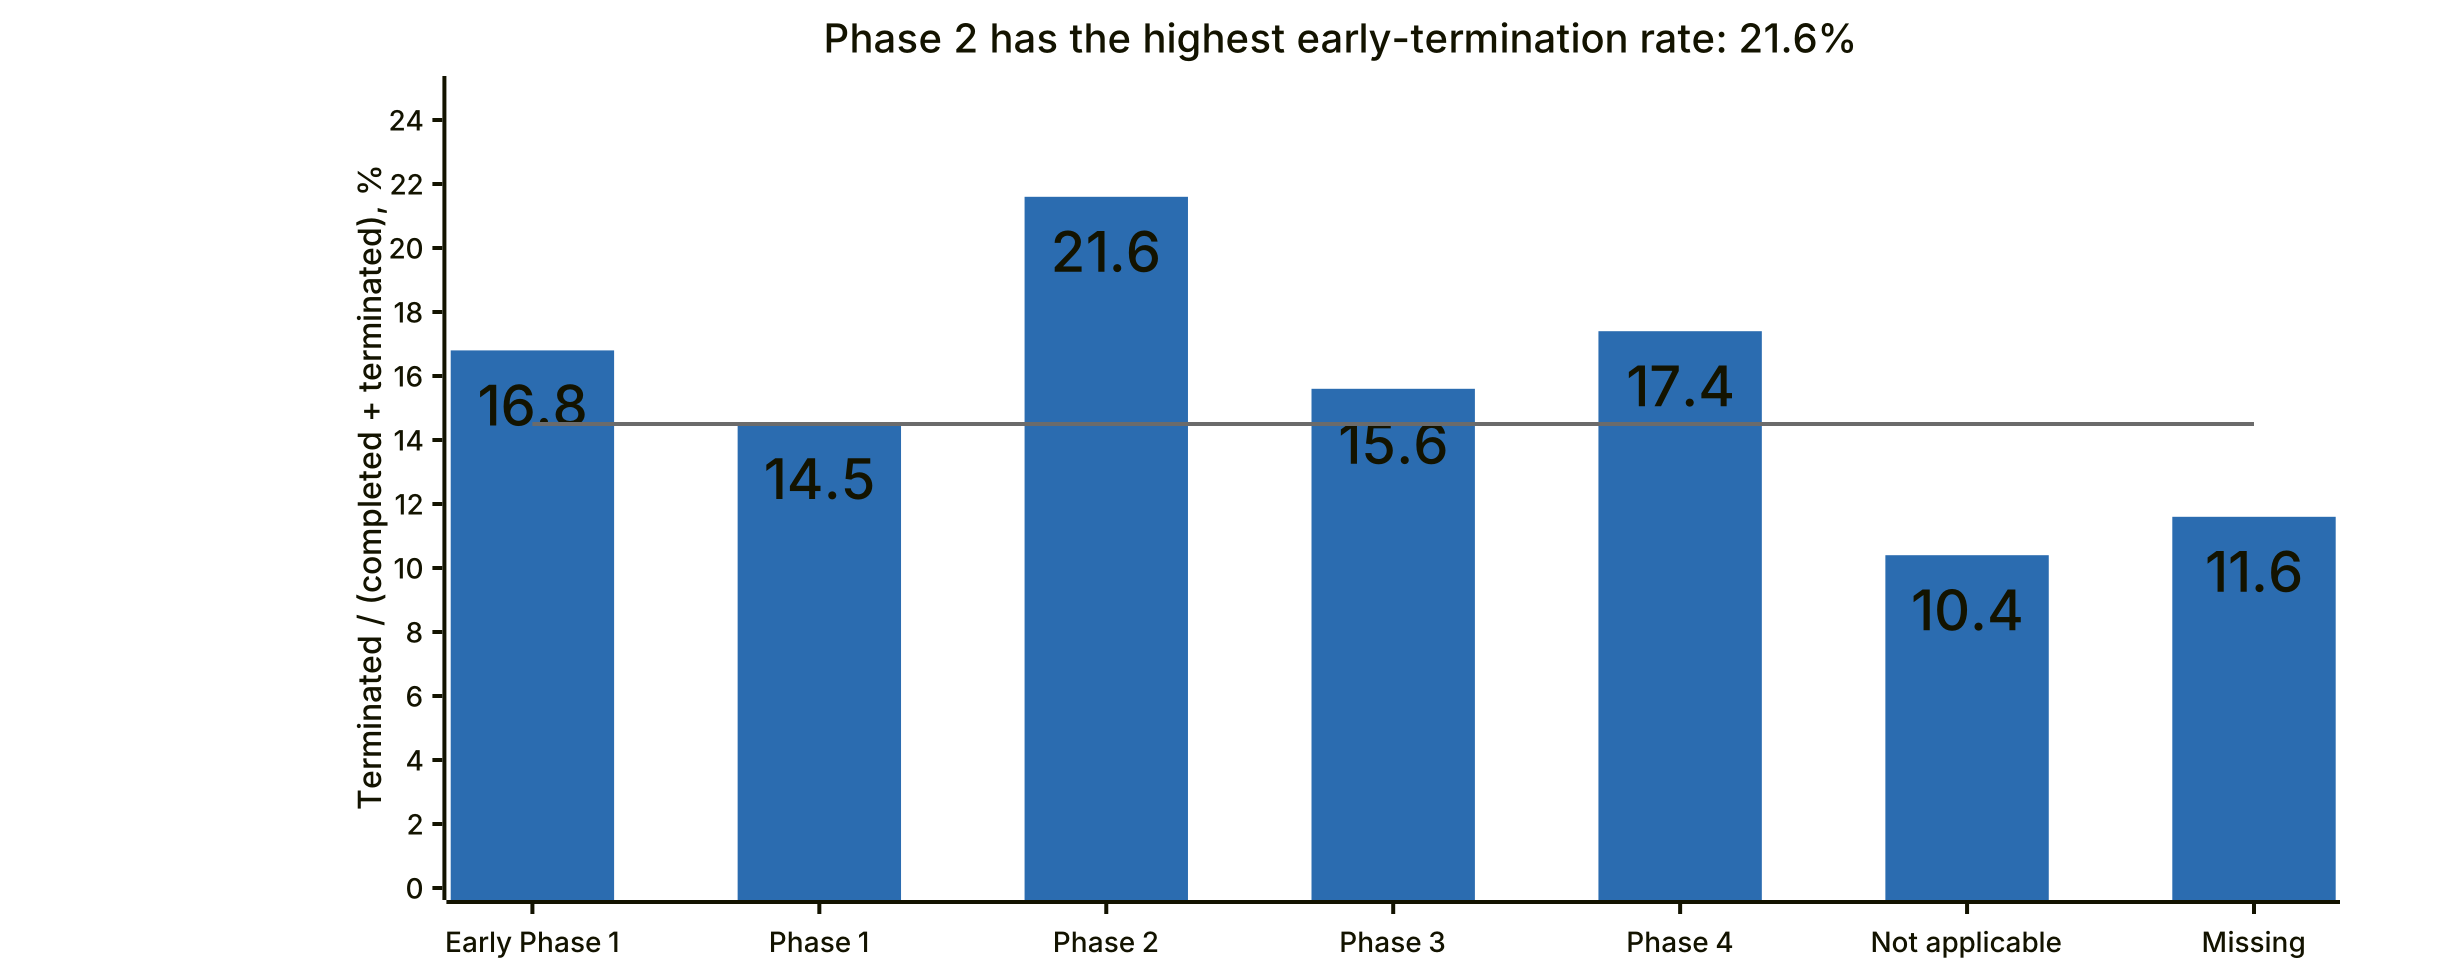
Terminated ÷ (completed + terminated), by development phase. The line marks all studies (14.5%). Combined phases such as Phase 1/2 count in the higher phase. Source: ClinicalTrials.gov, data as of Nov 6, 2026.
The drop-off is steepest in cancer and blood disorders. Oncology runs 4.9 Phase 2 studies for every Phase 3, and hematology 4.1, against 2.1 overall. The same two areas have the highest early-termination rates.
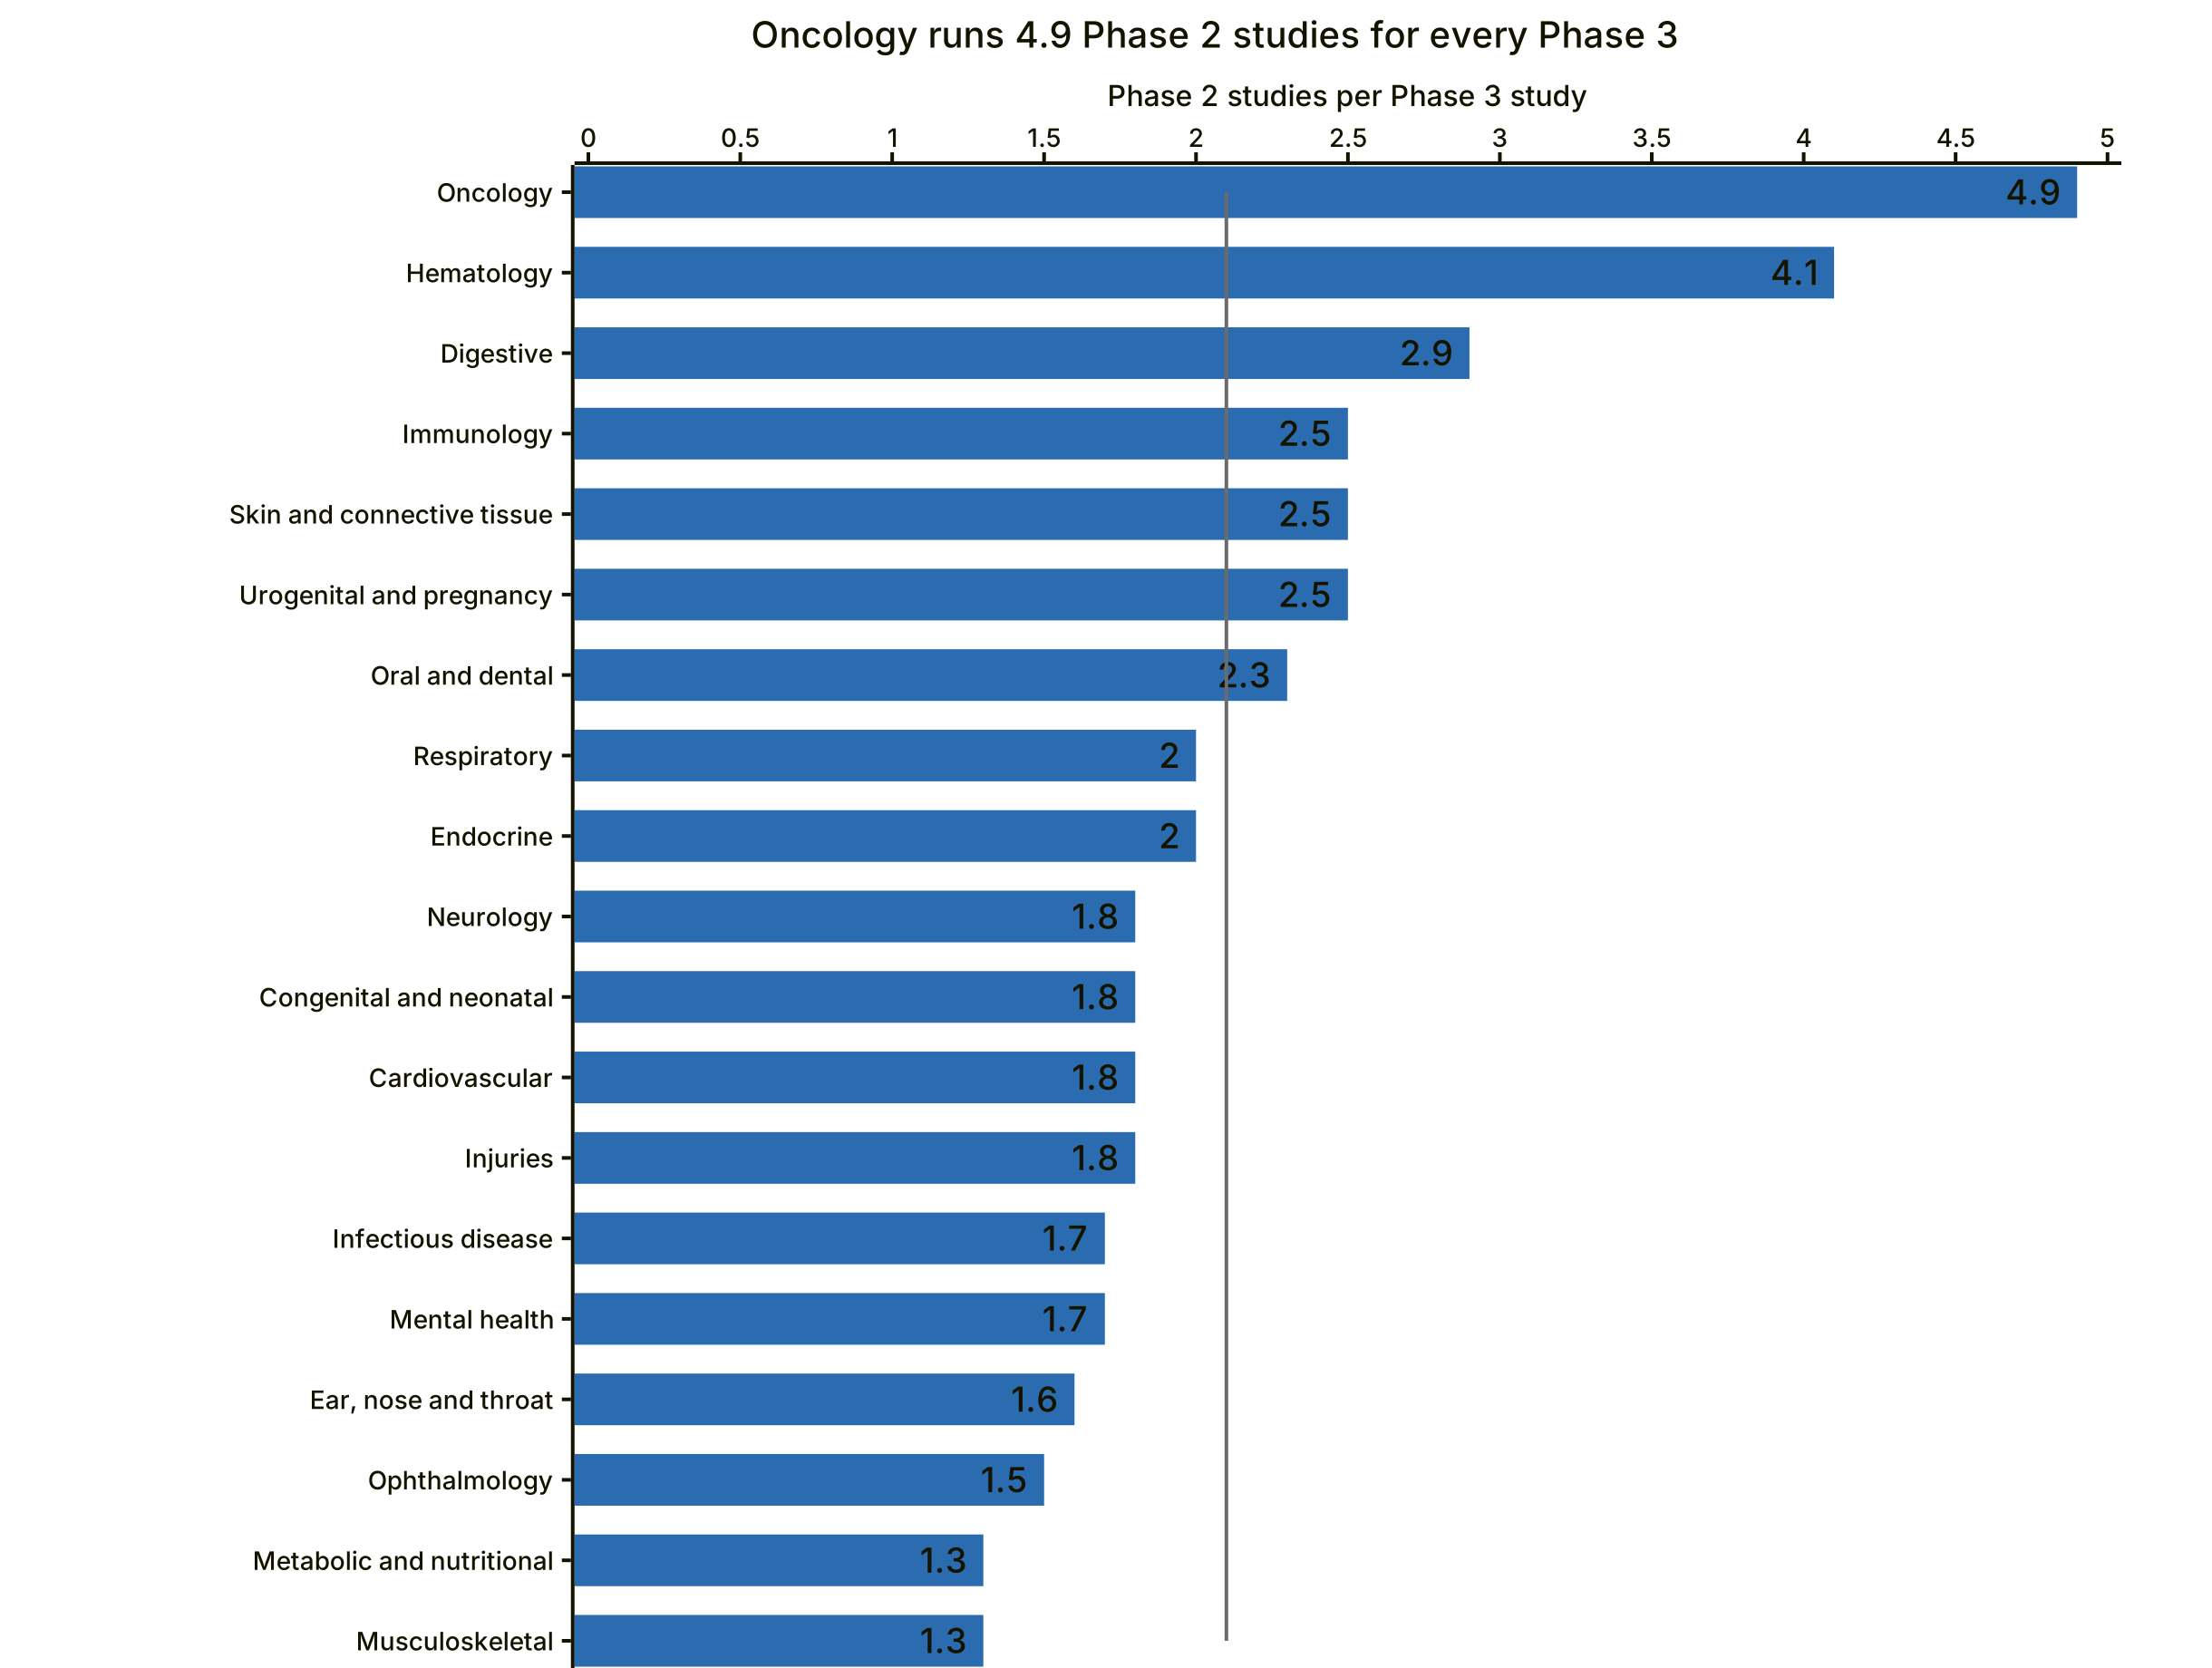
Phase 2 studies per Phase 3 study, all U.S.-linked studies by therapeutic area. The line marks all studies (2.1). Source: ClinicalTrials.gov, data as of Nov 6, 2026.
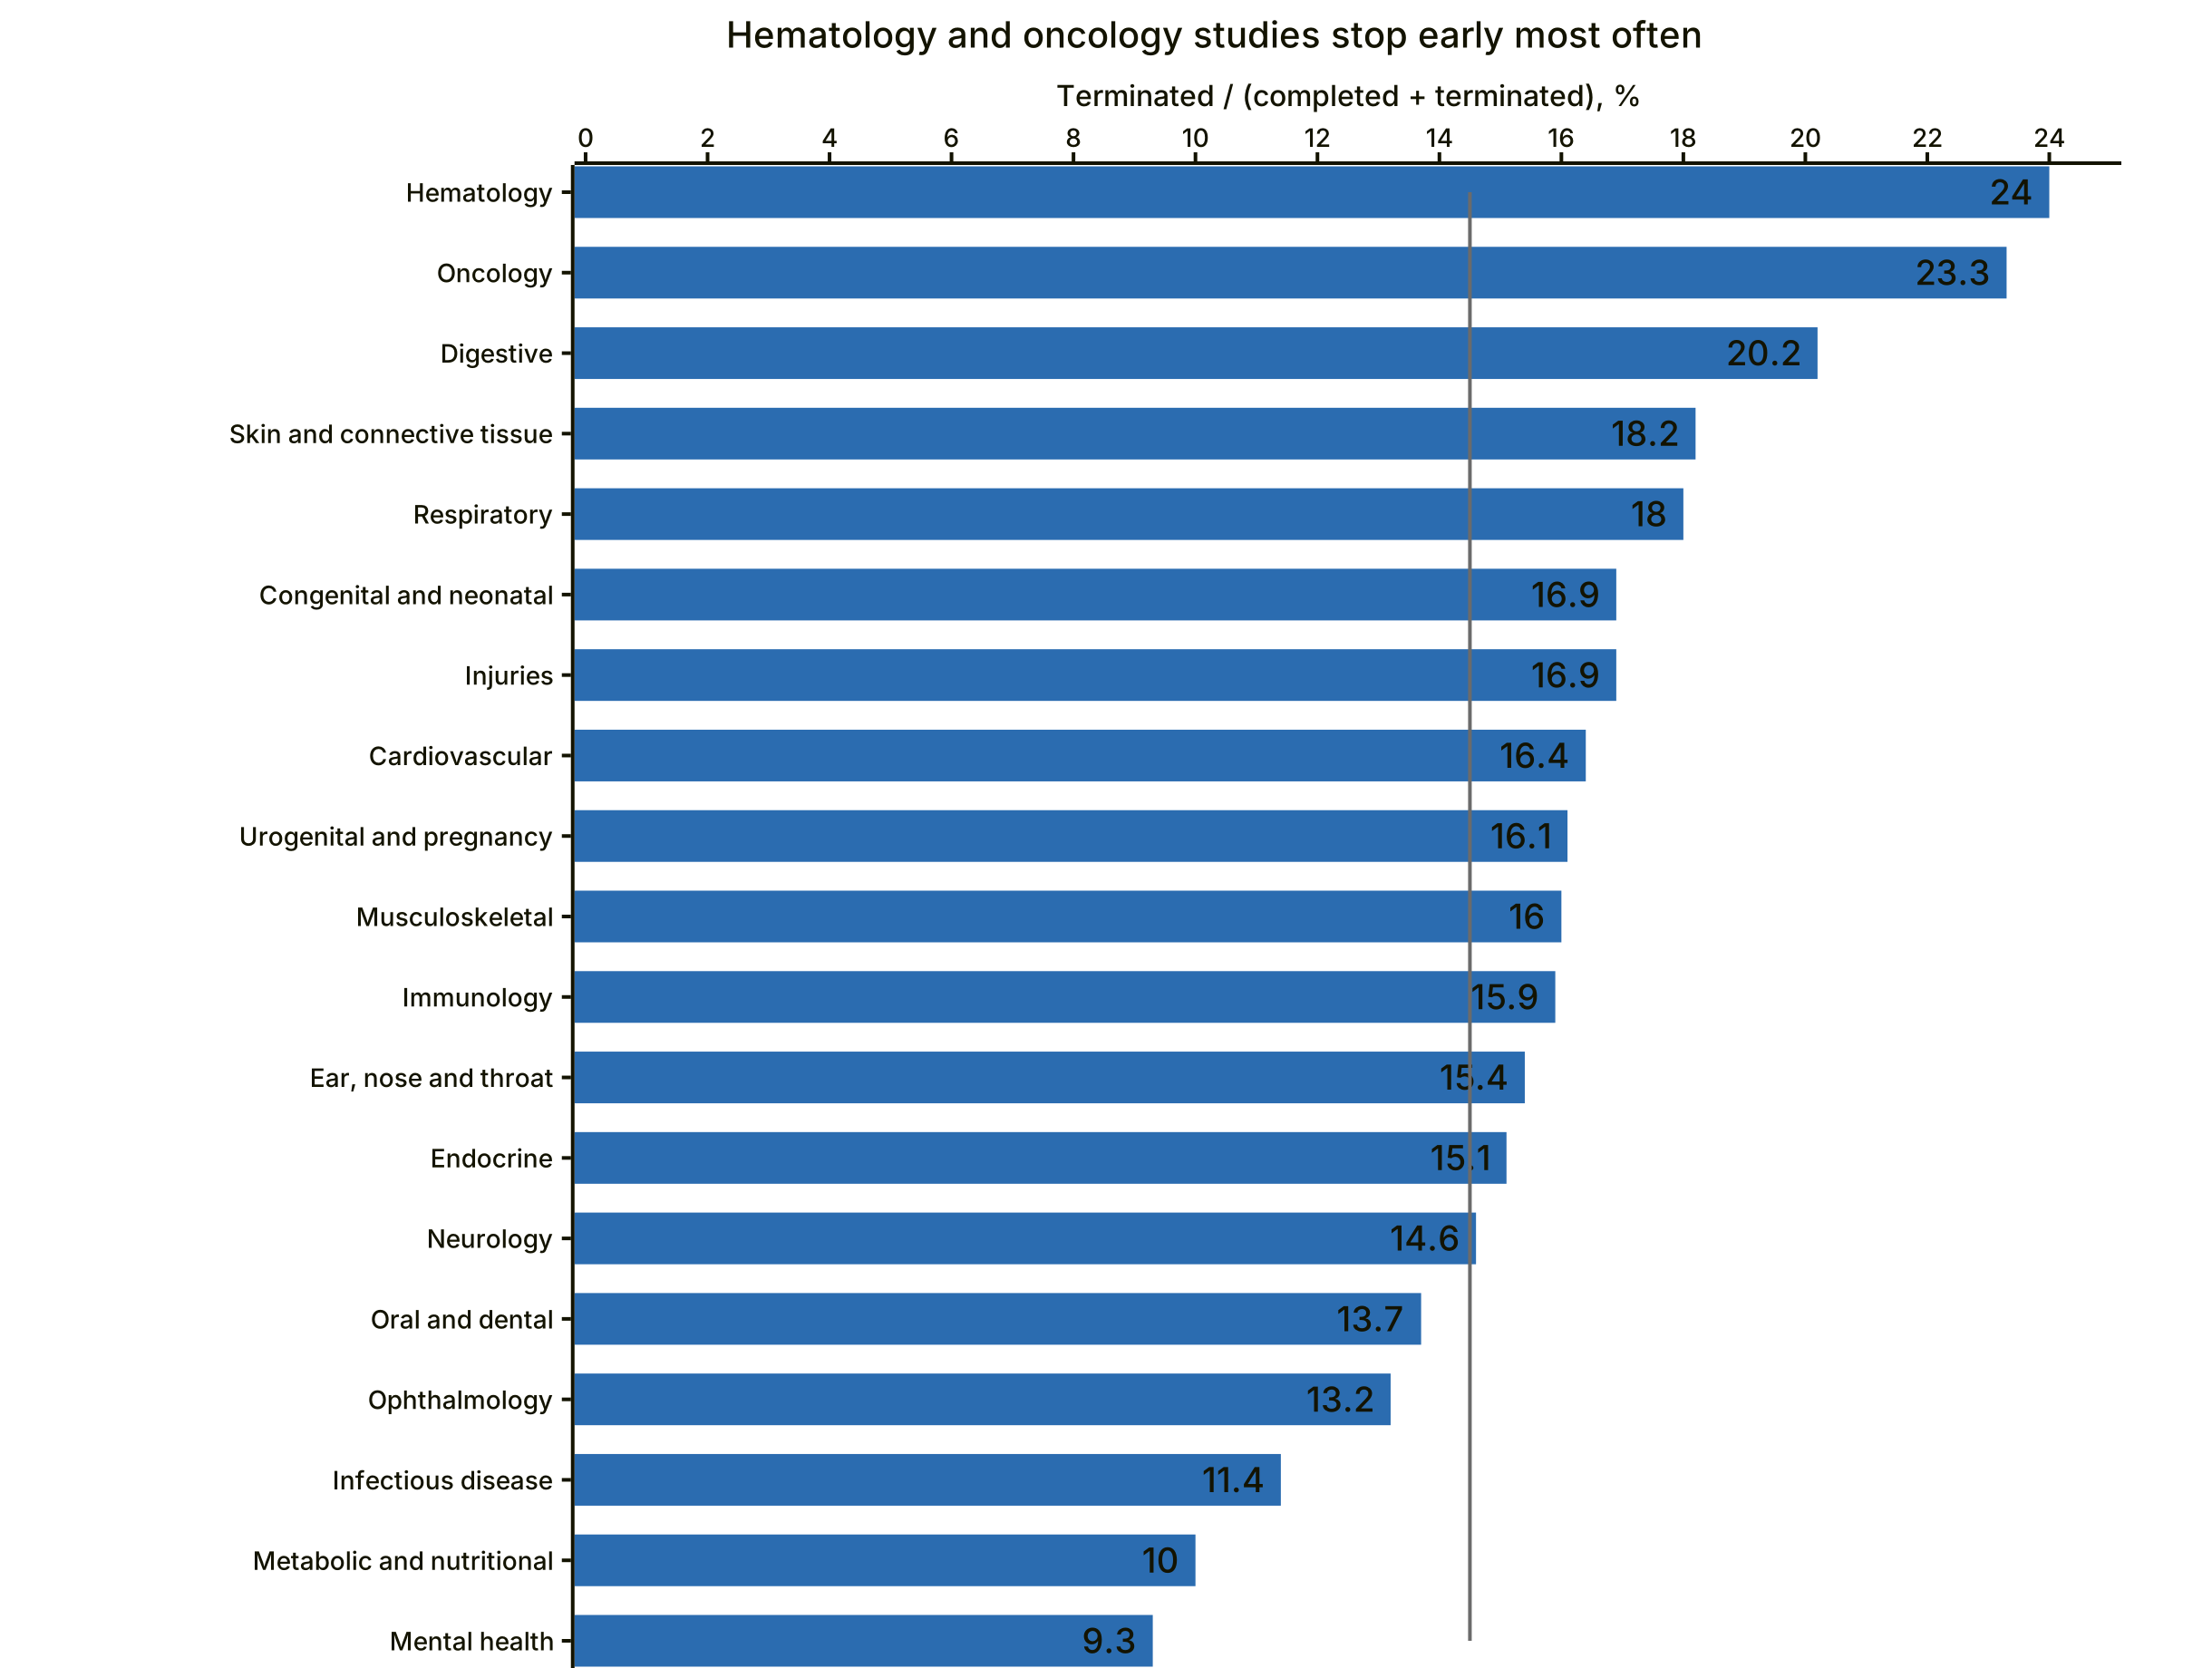
Terminated ÷ (completed + terminated) by therapeutic area. The line marks all studies (14.5%). Source: ClinicalTrials.gov, data as of Nov 6, 2026.
| Therapeutic area | Phase 2 per Phase 3 | Terminated early | Industry-led |
|---|---|---|---|
| Oncology | 4.9 | 23.3% | 27.6% |
| Hematology | 4.1 | 24.0% | 32.4% |
| Digestive | 2.9 | 20.2% | 33.6% |
| Immunology | 2.5 | 15.9% | 36.1% |
| Skin and connective tissue | 2.5 | 18.2% | 42.1% |
| Urogenital and pregnancy | 2.5 | 16.1% | 28.5% |
| Oral and dental | 2.3 | 13.7% | 29.7% |
| Respiratory | 2.0 | 18.0% | 37.5% |
| Endocrine | 2.0 | 15.1% | 33.0% |
| Neurology | 1.8 | 14.6% | 26.0% |
| Congenital and neonatal | 1.8 | 16.9% | 36.5% |
| Cardiovascular | 1.8 | 16.4% | 29.8% |
| Injuries | 1.8 | 16.9% | 14.6% |
| Infectious disease | 1.7 | 11.4% | 33.8% |
| Mental health | 1.7 | 9.3% | 17.8% |
| Ear, nose and throat | 1.6 | 15.4% | 29.9% |
| Ophthalmology | 1.5 | 13.2% | 47.2% |
| Metabolic and nutritional | 1.3 | 10.0% | 28.3% |
| Musculoskeletal | 1.3 | 16.0% | 38.4% |
| All U.S.-linked studies | 2.1 | 14.5% | 30.8% |
When sponsors give a reason for stopping, the most common is slow enrollment or accrual: at least 30.3% of terminations (6,238 of 20,593). That is a lower bound, because reasons that mention enrollment alongside another cause are counted under the other cause.
Finding 4: Children Are Left Out of Most Research
Children are eligible for 16.5% of recruiting interventional studies. Adults 65 and older are eligible for 80.6%. Child eligibility is lowest in the areas where adult disease is heaviest: cardiovascular (8.7%), digestive (10.2%) and oncology (10.5%).
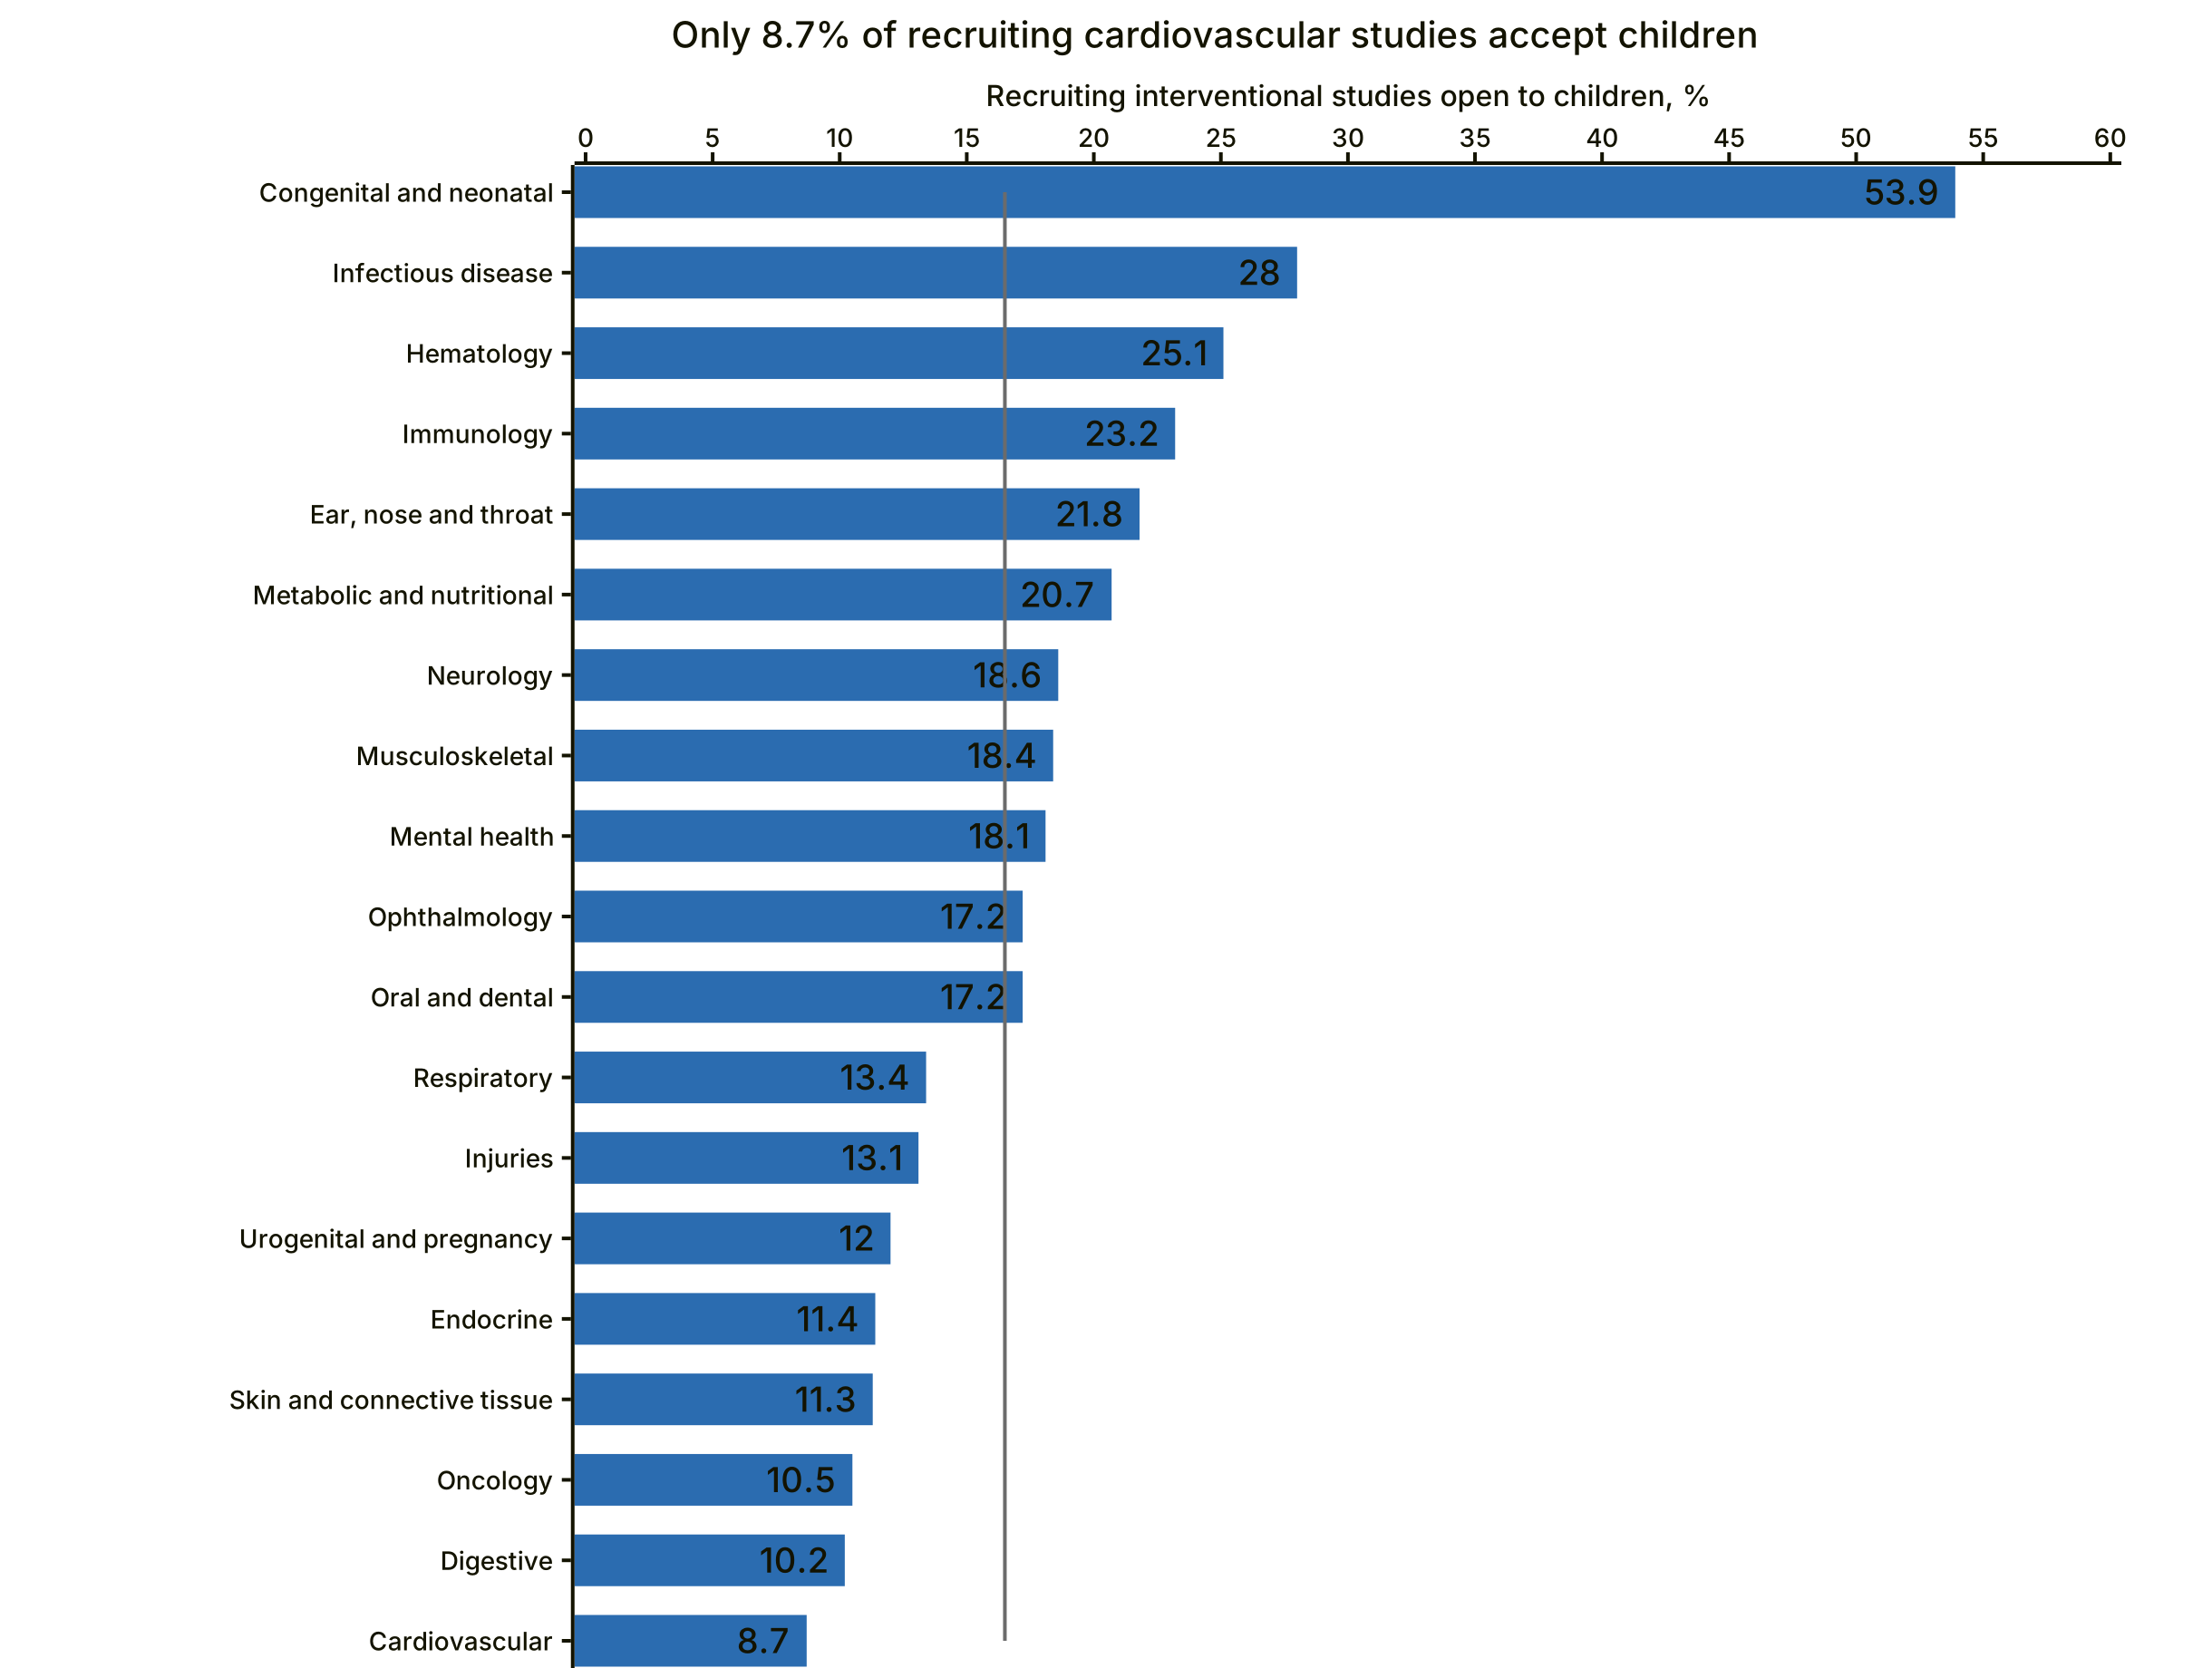
Share of recruiting interventional U.S.-linked studies whose eligibility includes children, using ClinicalTrials.gov’s standardized age groups. The line marks all studies (16.5%). Source: ClinicalTrials.gov, data as of Nov 6, 2026.
Older adults are excluded most often from mental health studies (69.0% eligible) and metabolic and nutritional studies (71.2%).
Finding 5: Academic Centers Lead, and NIH-Led Research Has Shrunk
Academic medical centers, hospitals and nonprofits lead 60.5% of all U.S.-linked studies and 71.0% of those recruiting now. Industry leads 30.8% of all studies but only 22.6% of recruiting ones.
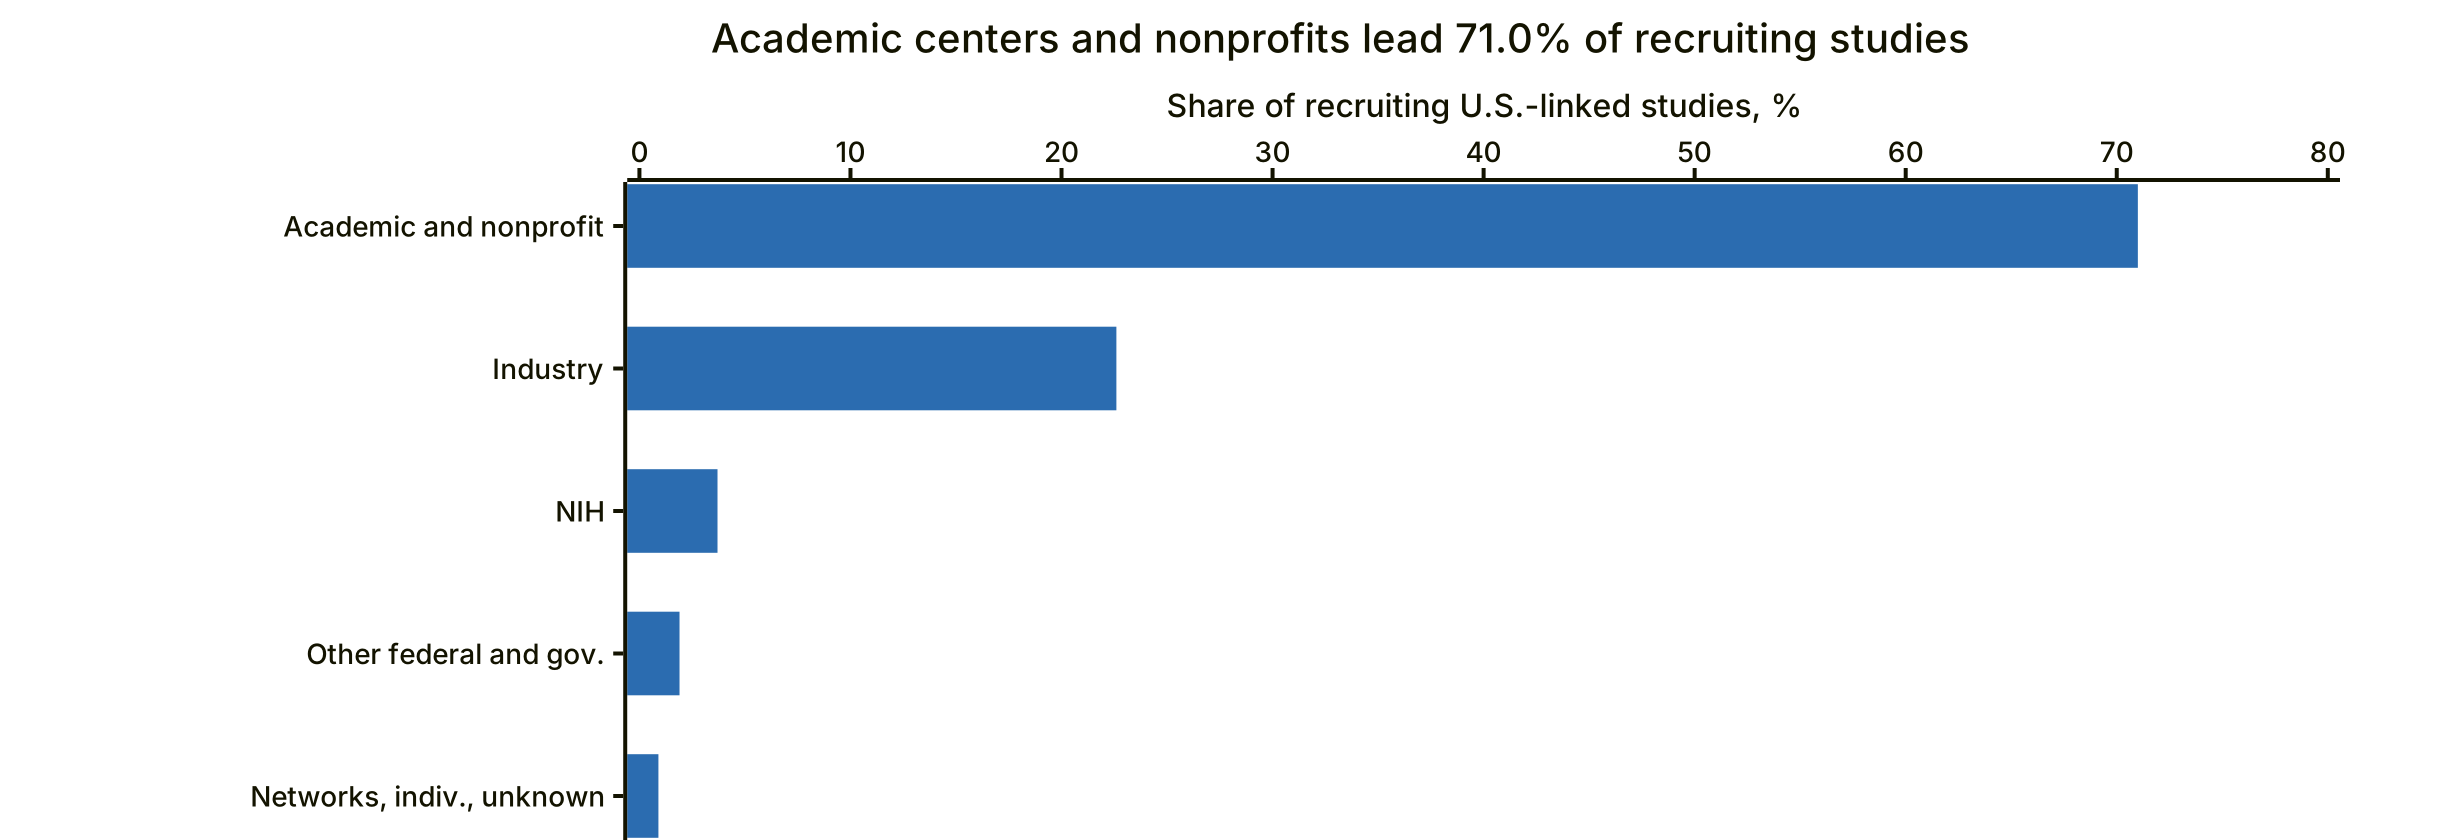
Lead sponsor class of the 22,051 recruiting U.S.-linked studies. Source: ClinicalTrials.gov, data as of Nov 6, 2026.
| Lead sponsor class | All studies | Share | Recruiting | Share of recruiting |
|---|---|---|---|---|
| Academic, hospital, nonprofit (“Other”) | 119,106 | 60.5% | 15,650 | 71.0% |
| Industry | 60,622 | 30.8% | 4,975 | 22.6% |
| NIH | 10,048 | 5.1% | 809 | 3.7% |
| Other federal and government | 4,688 | 2.4% | 419 | 1.9% |
| Networks, individuals, unknown | 2,363 | 1.2% | 198 | 0.9% |
Studies with an NIH institute as lead sponsor have fallen by almost two-thirds, from 356 starts in 2010 to 130 in 2025. Industry’s share of starts barely moved, from 32.5% to 32.3%.
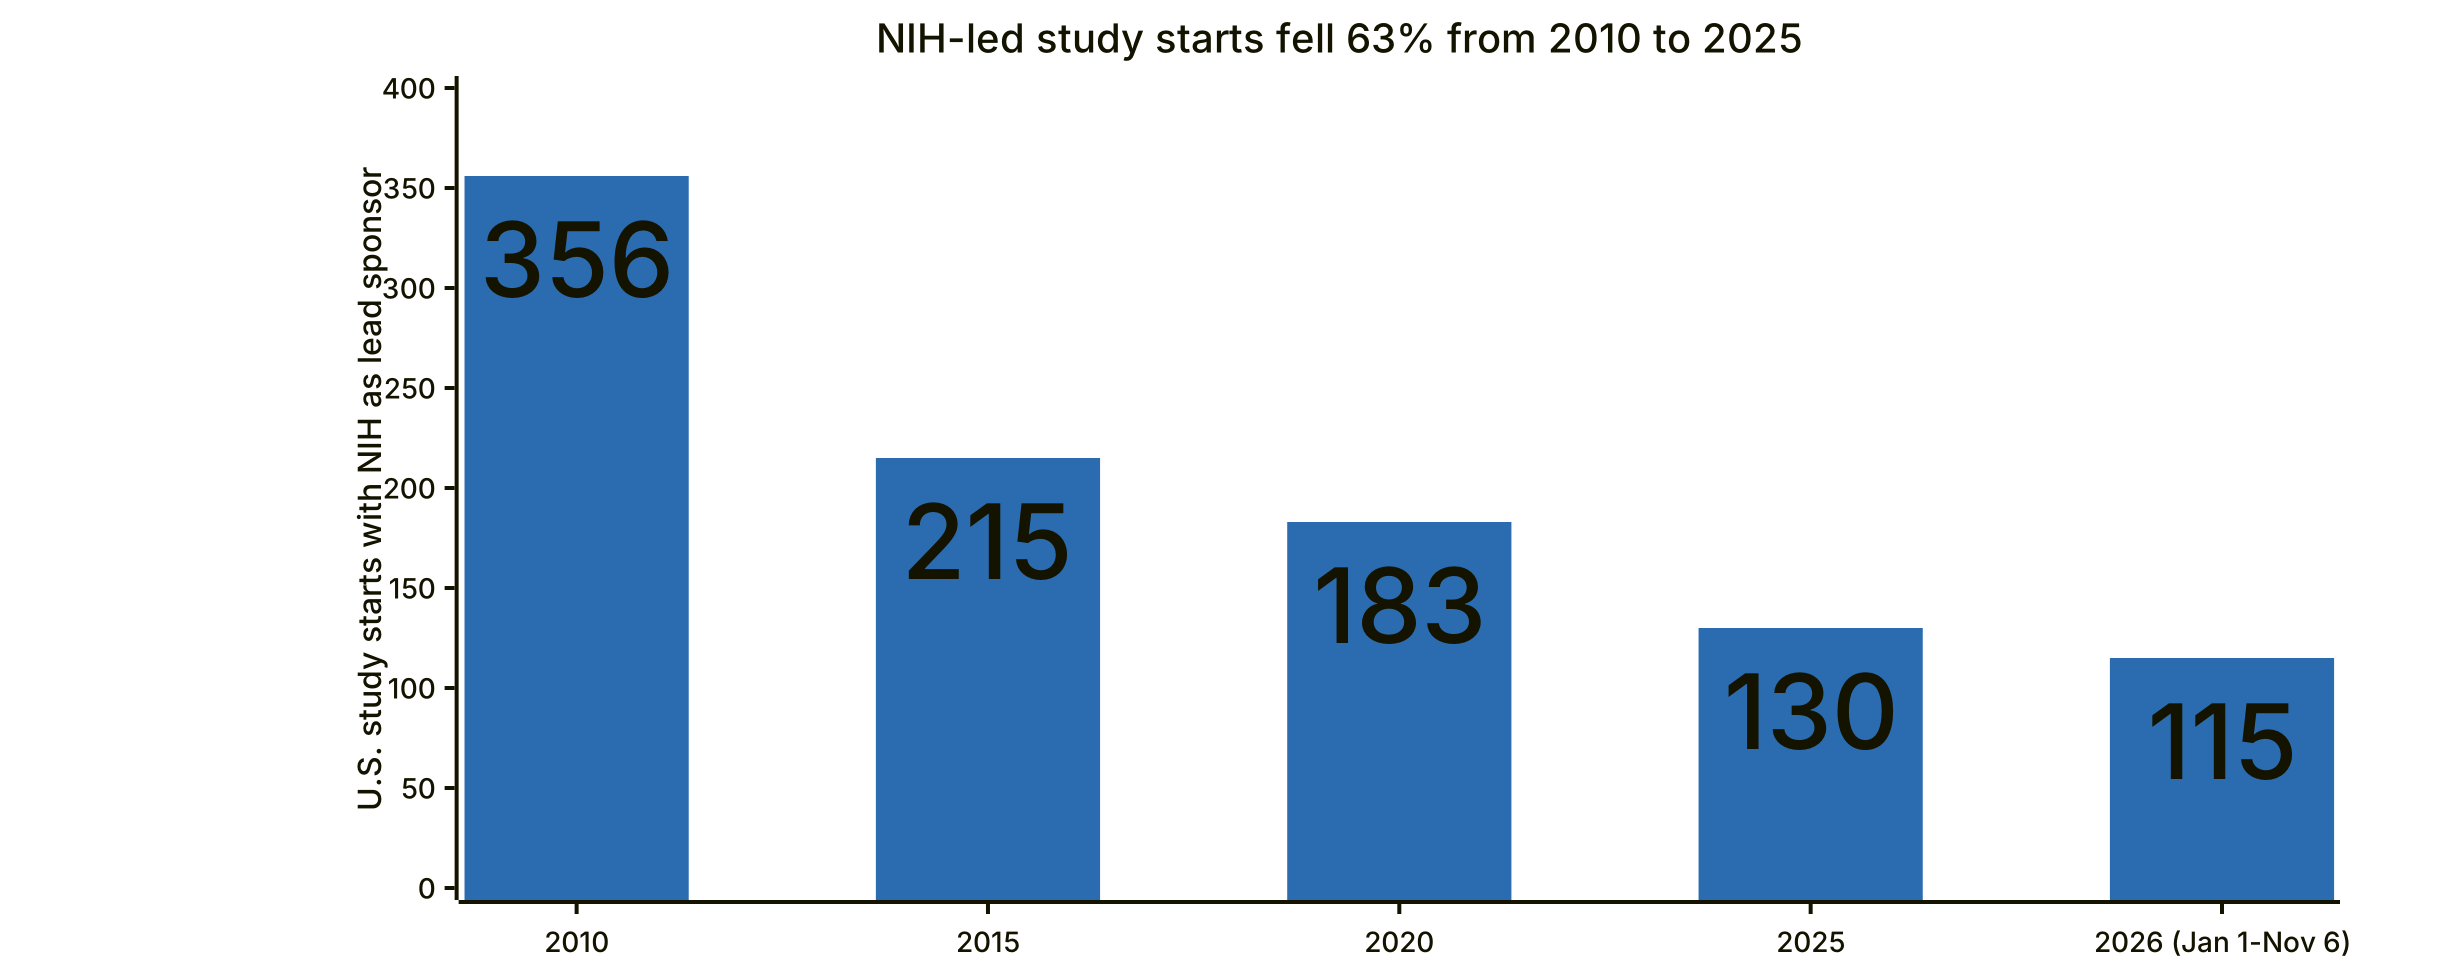
U.S. study starts with an NIH institute as the registered lead sponsor. NIH also funds many studies that universities lead; those are not counted here. Source: ClinicalTrials.gov, data as of Nov 6, 2026.
Finding 6: Study Starts Are Rising Again
U.S. study starts climbed from 1,364 in 2000 to a peak of 10,786 in 2021, then fell for four years. 2026 has turned: 8,304 studies started between Jan 1 and Nov 6, 3.3% more than over the same dates in 2025.
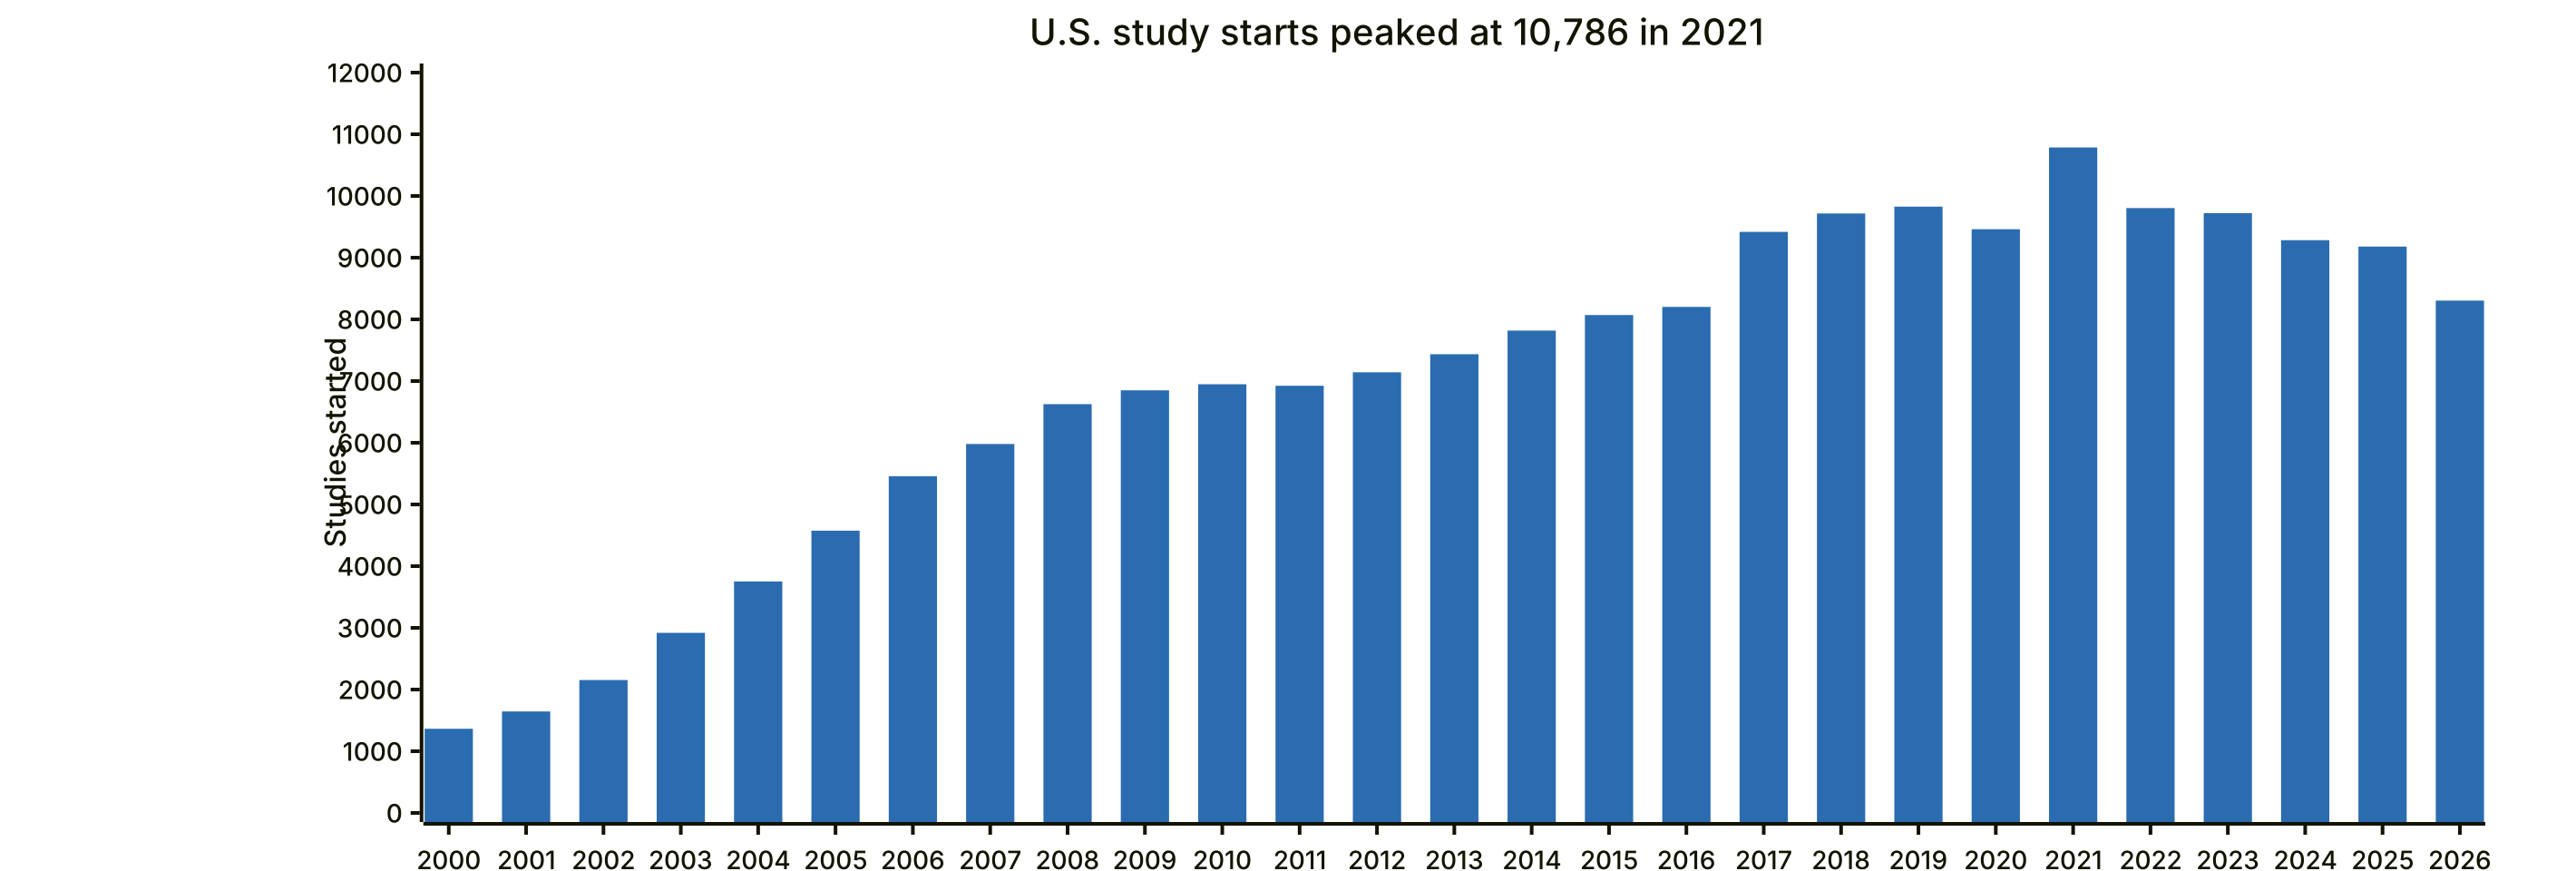
U.S. study starts by year. 2026 covers Jan 1 to Nov 6; 642 studies with later planned start dates are excluded. Source: ClinicalTrials.gov, data as of Nov 6, 2026.
| Period (Jan 1–Nov 6) | Study starts | Change on prior year |
|---|---|---|
| 2021 | 9,446 | |
| 2022 | 8,689 | −8.0% |
| 2023 | 8,458 | −2.7% |
| 2024 | 8,097 | −4.3% |
| 2025 | 8,041 | −0.7% |
| 2026 | 8,304 | +3.3% |
The Wider Landscape
Half of U.S.-linked studies carry no drug phase: 67,415 interventional studies of devices, behaviors or procedures, and 32,290 observational or expanded-access studies.
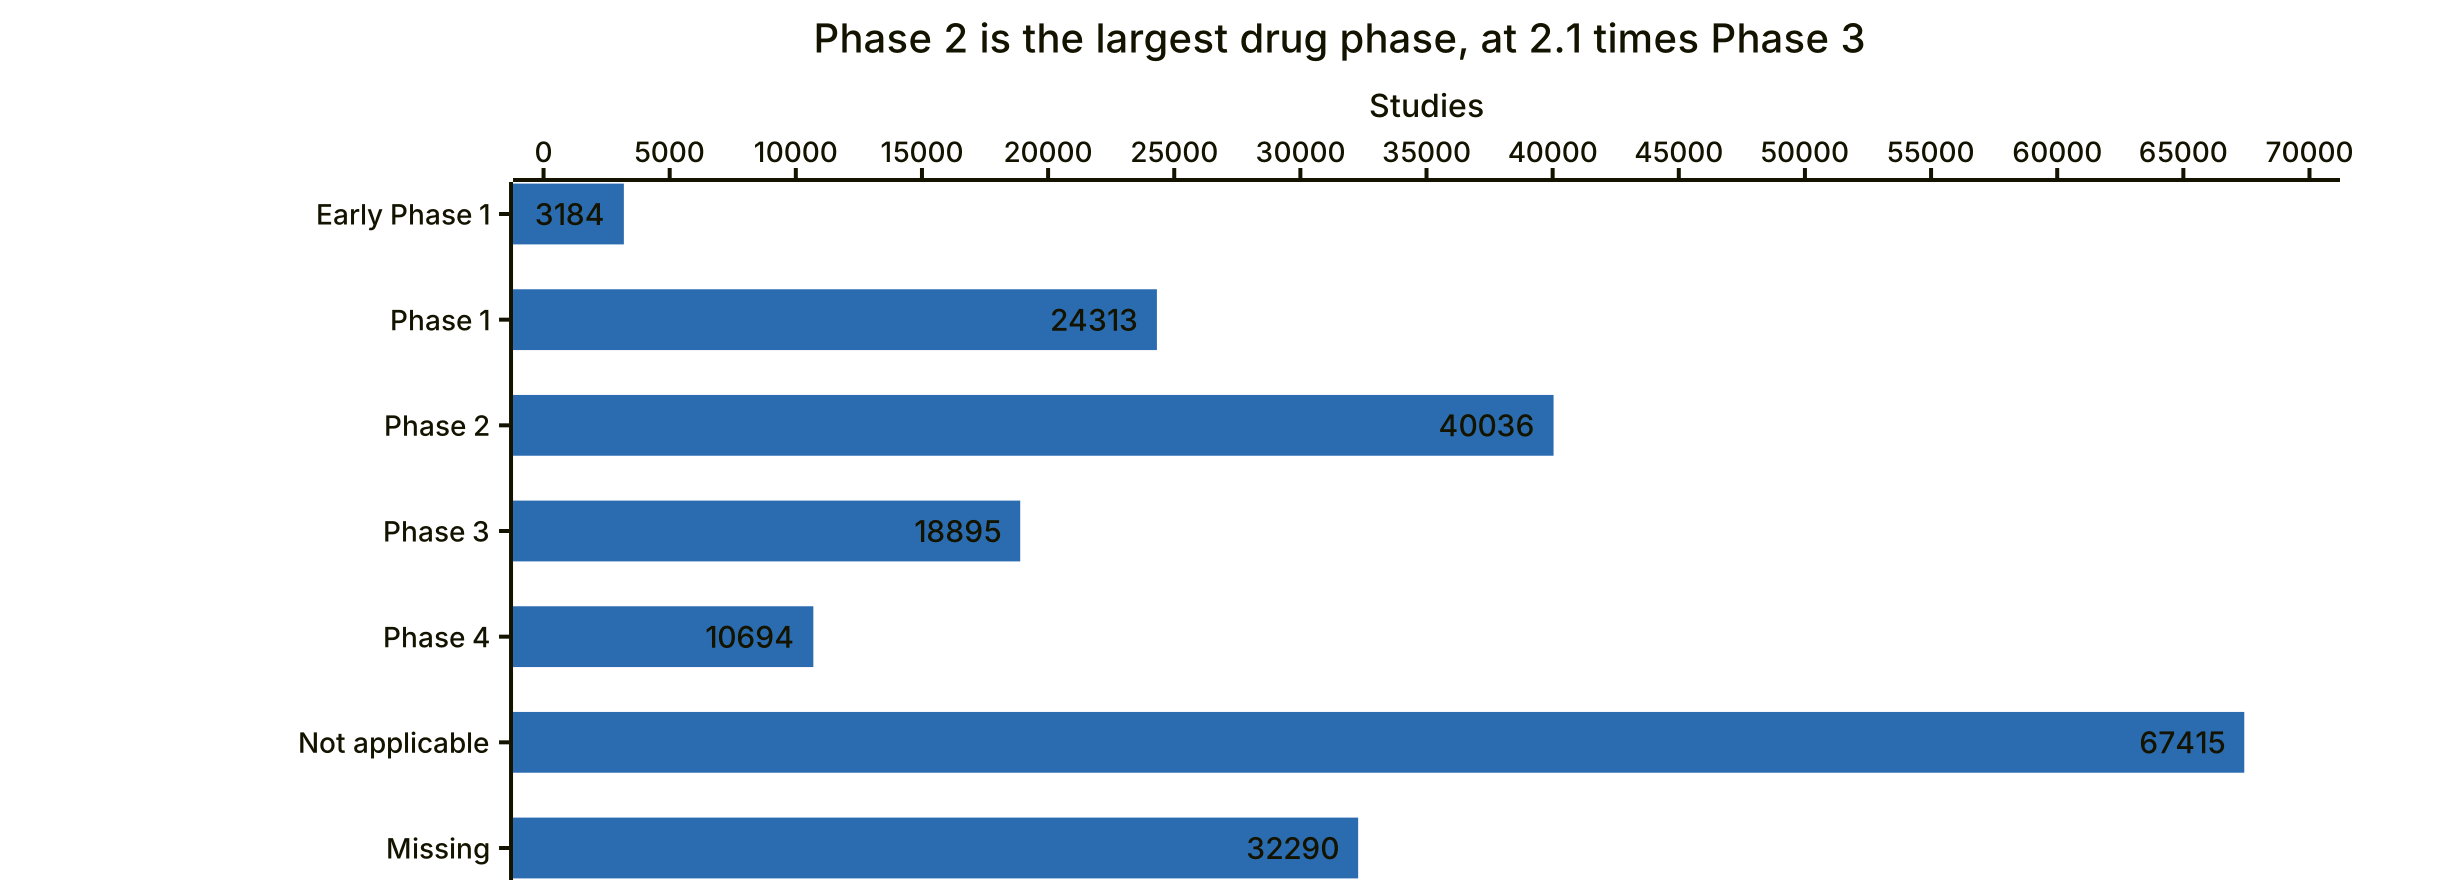
U.S.-linked studies by development phase group. Source: ClinicalTrials.gov, data as of Nov 6, 2026.
Recruiting studies concentrate in the most populous states, led by California (5,523), Texas (4,888) and New York (4,503). Wyoming has 56.
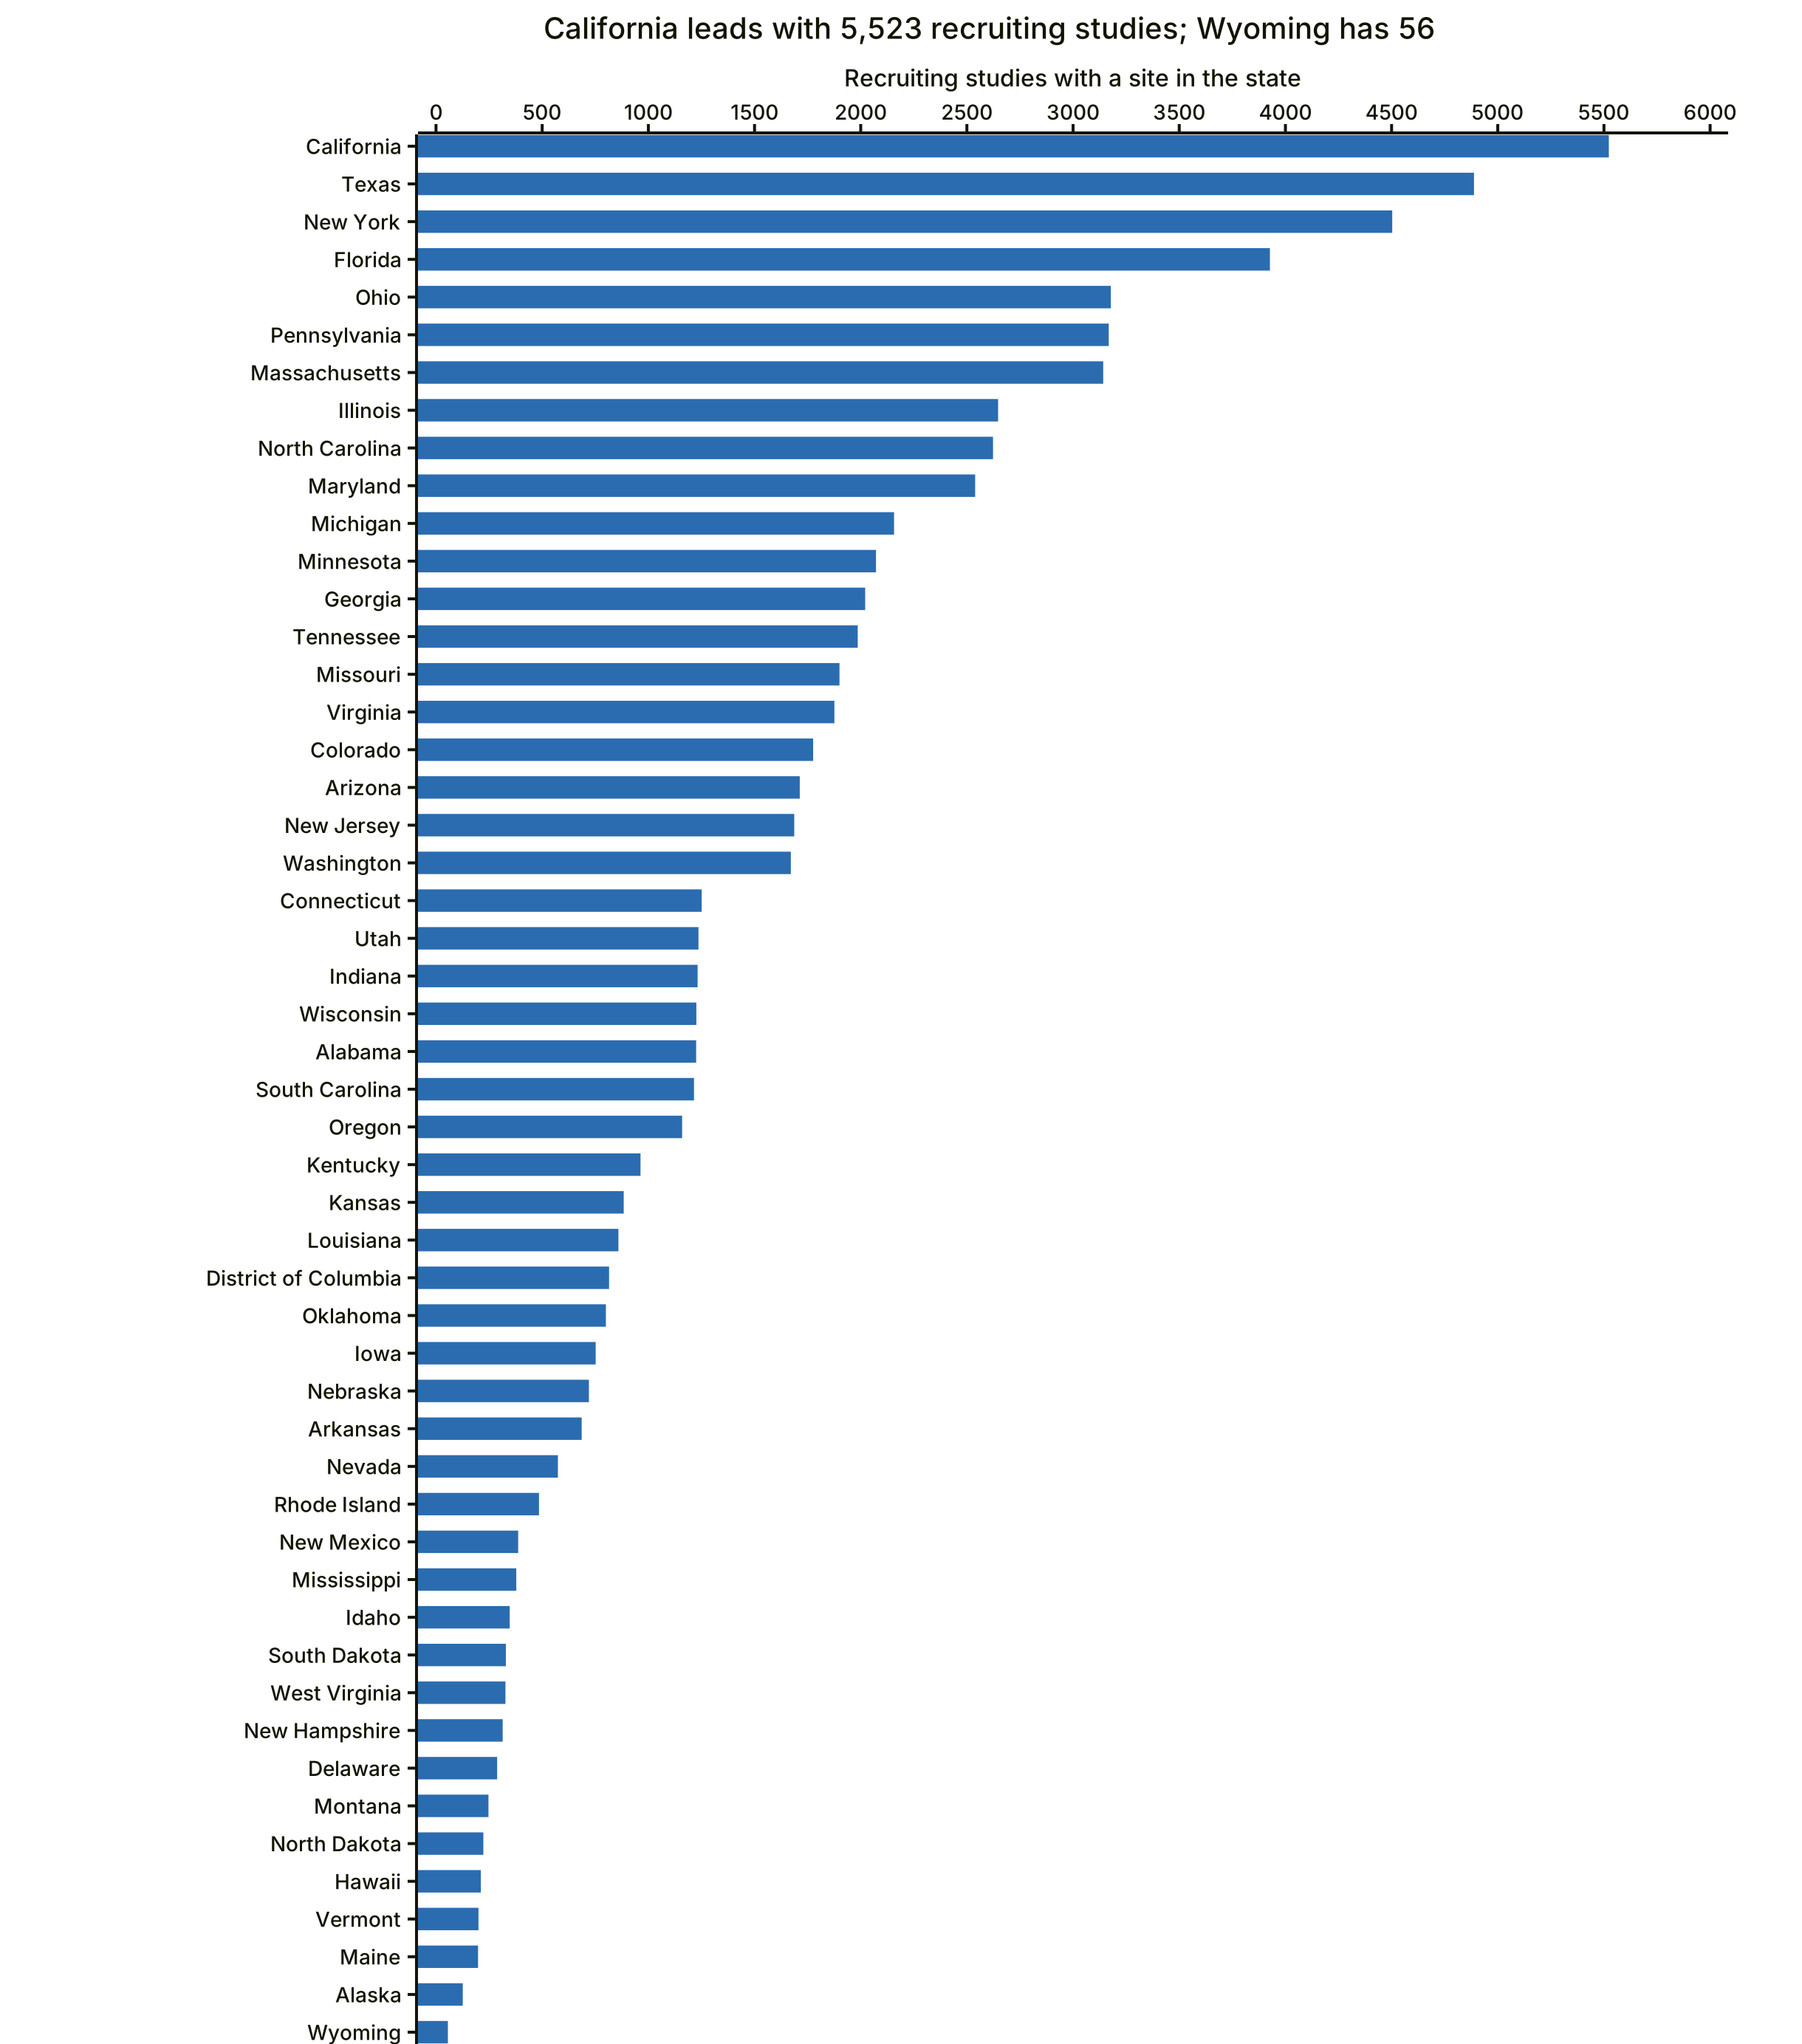
Recruiting studies with at least one site in each state. A study counts in every state where it has a site. Source: ClinicalTrials.gov, data as of Nov 6, 2026.
44.5% of completed interventional studies have posted results on ClinicalTrials.gov. Industry posts results for half its completed studies, and NIH for 31%. This is not a compliance rate, because many completed studies are not required to post results.
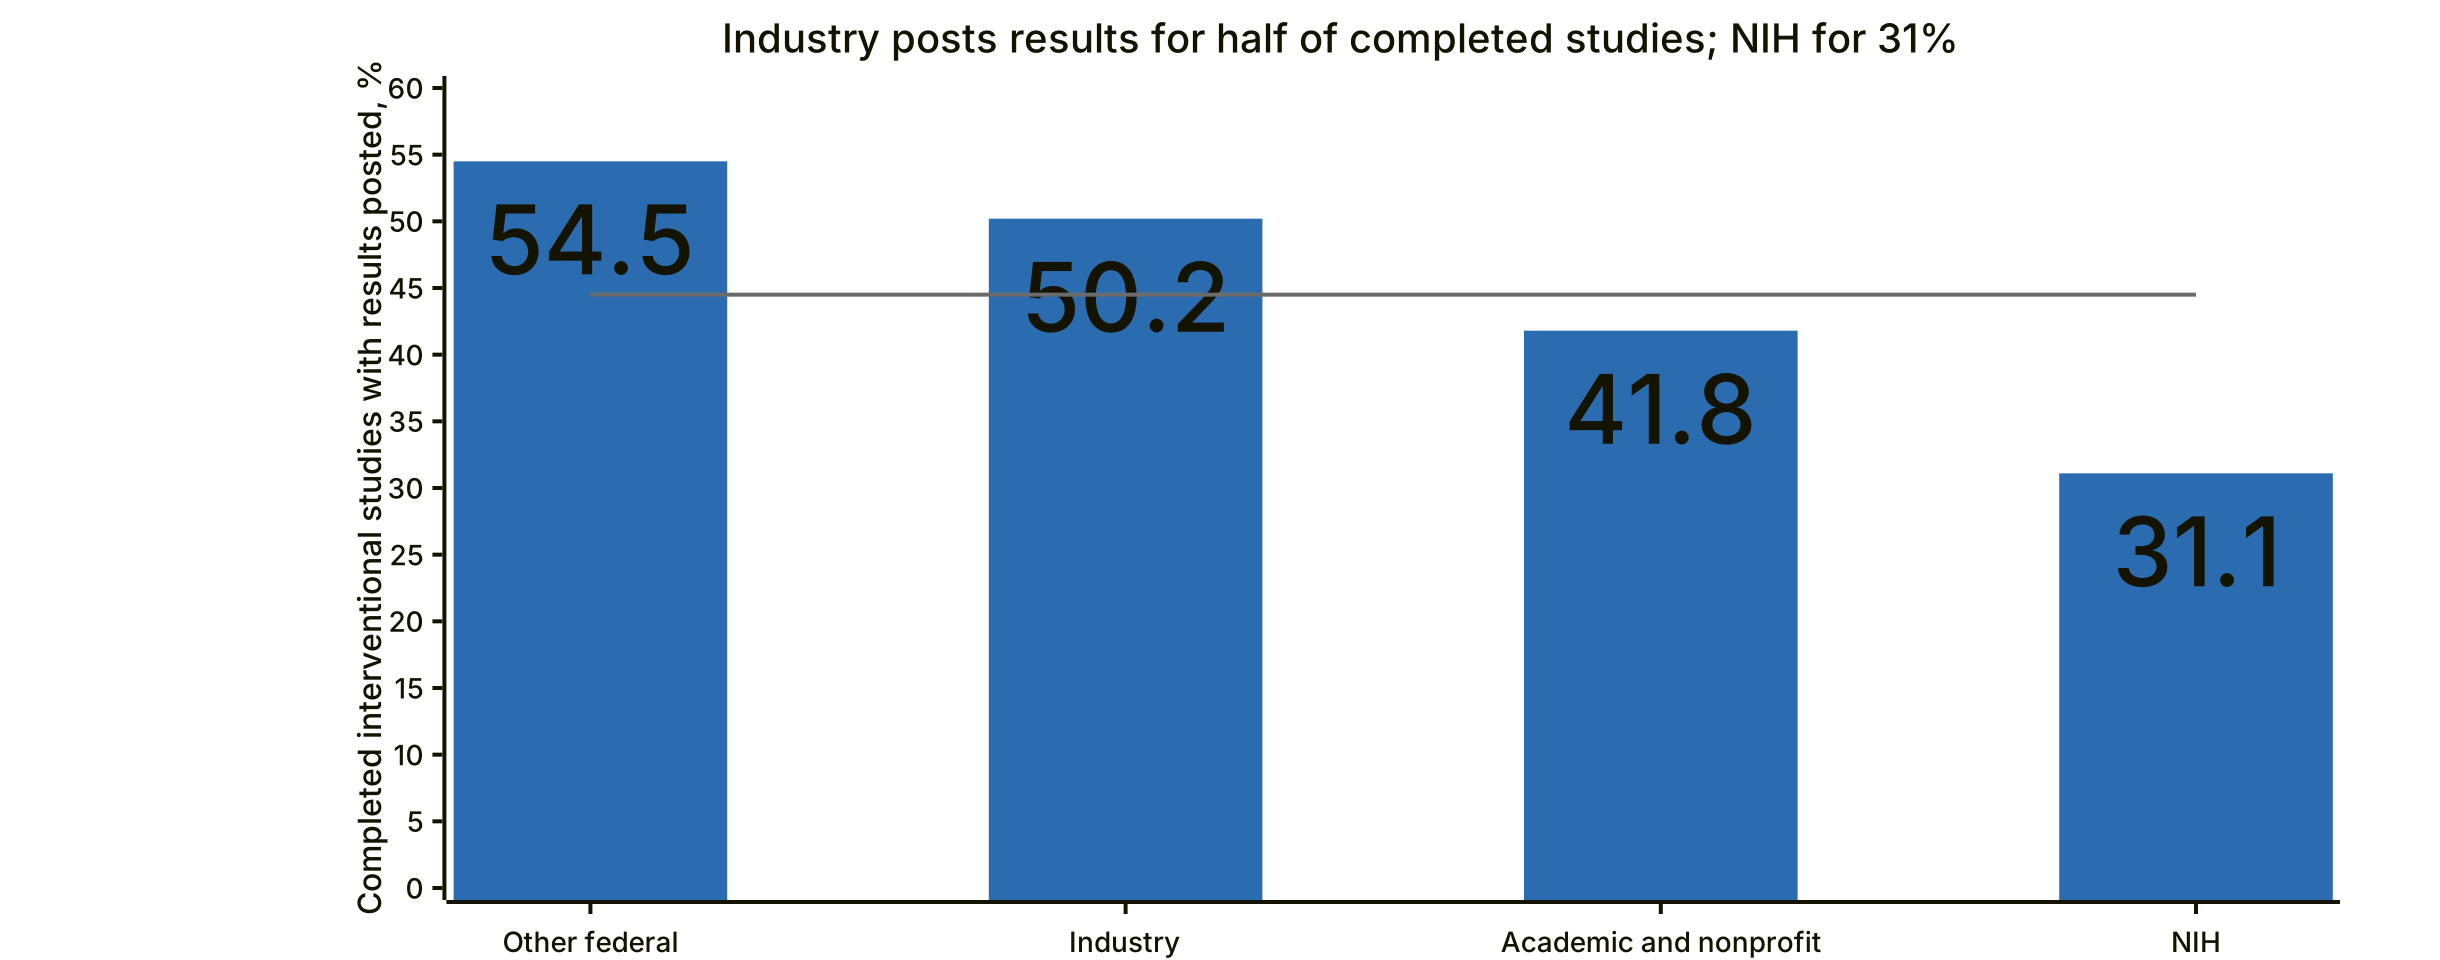
Completed interventional U.S.-linked studies with results posted, by lead sponsor class. The line marks all studies (44.5%). Source: ClinicalTrials.gov, data as of Nov 6, 2026.
A typical completed Phase 3 study enrolled 310 participants, against 54 in Phase 2 and 30 in Phase 1.
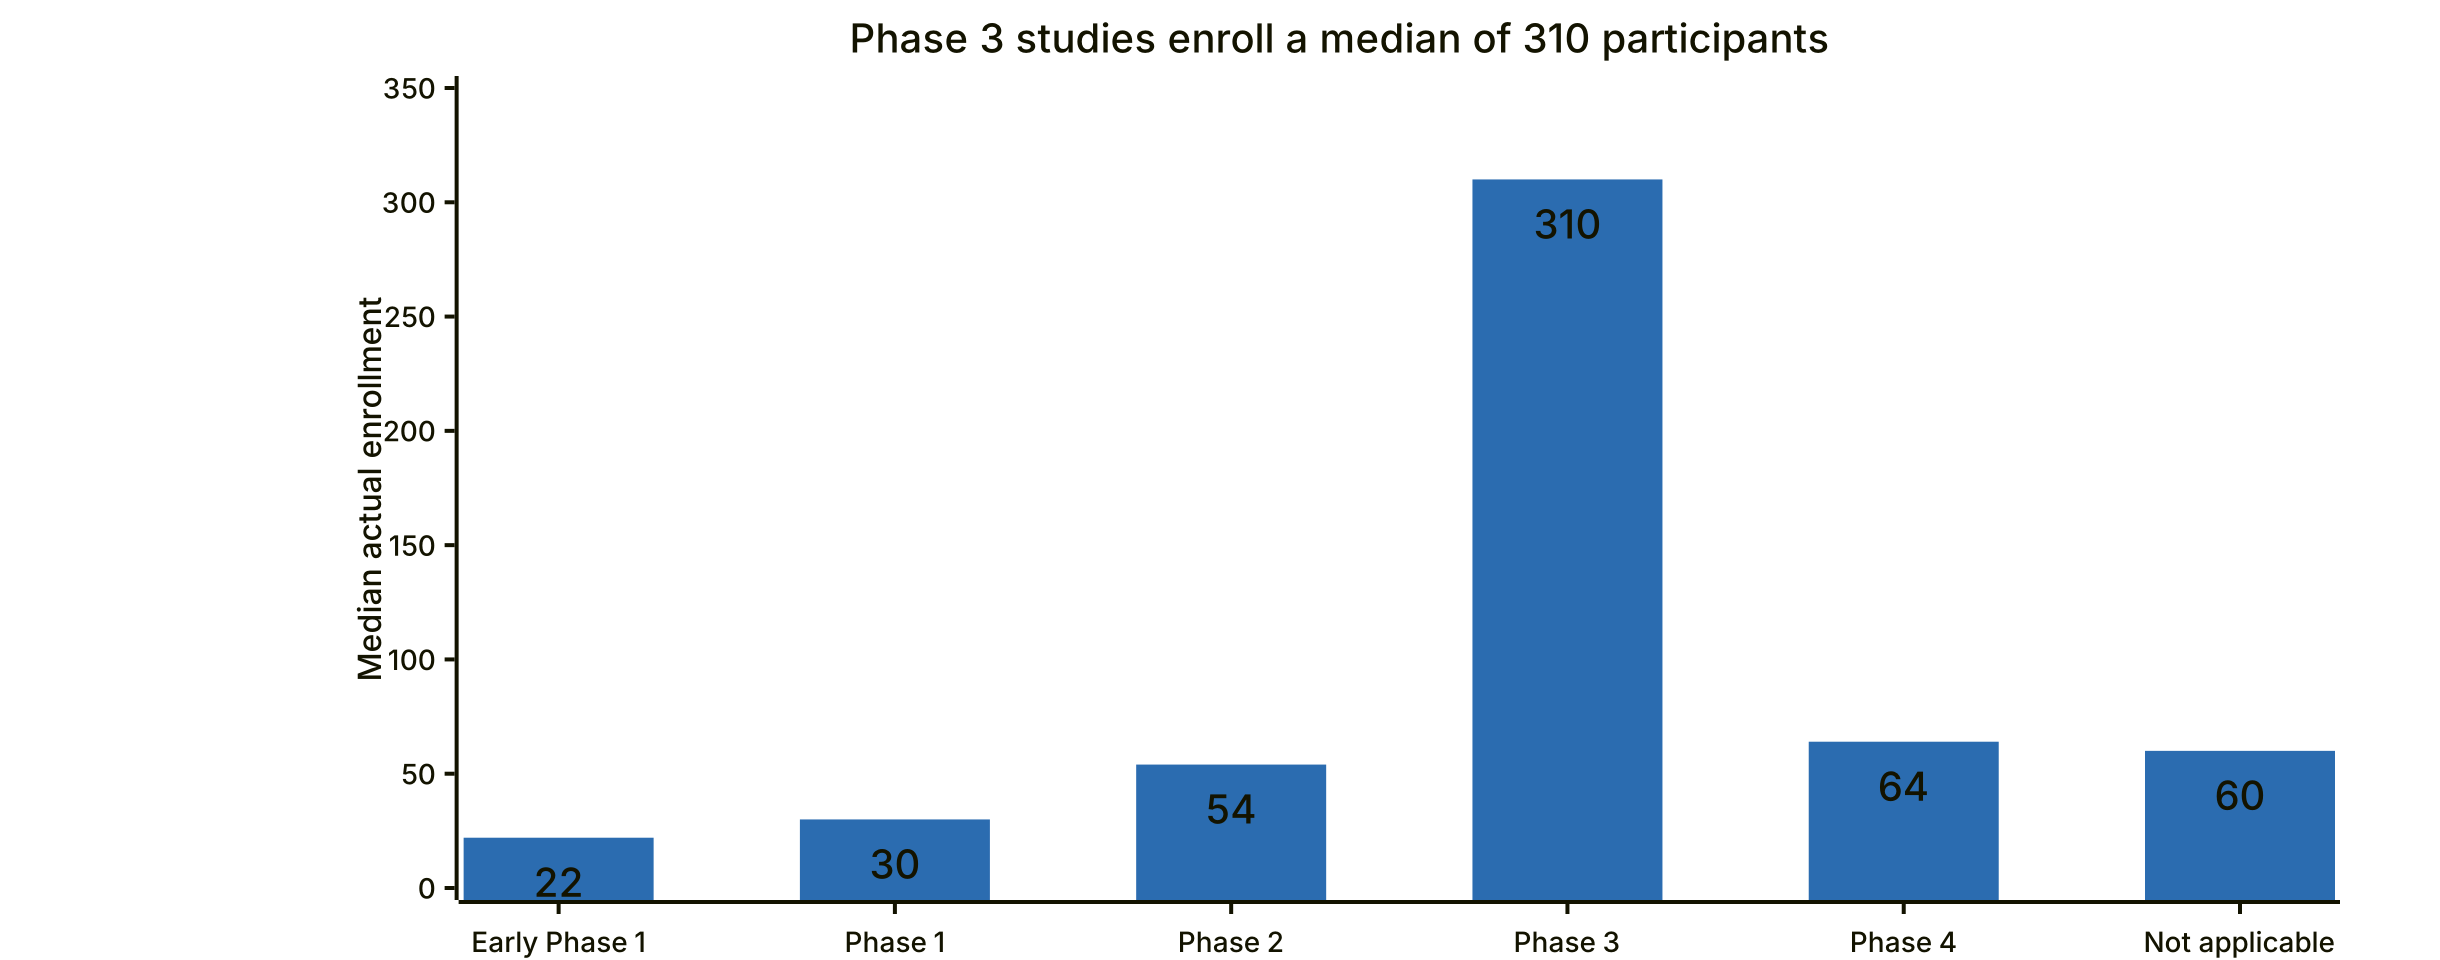
Median actual enrollment of completed interventional U.S.-linked studies. Source: ClinicalTrials.gov, data as of Nov 6, 2026.
What It Means
U.S. clinical research is deep where the science and the funding have historically been, and thin where the burden is broad but harder to study. The registry shows it plainly: more cancer trials than the death toll would suggest, fewer heart trials, and few studies that children can join.
For sponsors and investors: Phase 2 is where portfolios lose the most studies, and oncology loses the most between Phase 2 and Phase 3. Enrollment, not science, is the most common stated reason studies stop. Site selection and patient access are where early-phase risk can be reduced.
For research institutions and sites: Academic centers carry most active U.S. research, and NIH-led studies are a shrinking share. Recruiting capacity is concentrated in a handful of states, so studies in smaller states compete for fewer sites.
For policymakers and patient advocates: Cardiovascular disease, the leading cause of death, has a third as many recruiting studies per death as cancer. Children are eligible for one study in six. Both gaps are visible in public data and can be tracked year to year.
Key Numbers for Reporters
- 196,827 studies on ClinicalTrials.gov list at least one U.S. site; 22,051 are recruiting.
- Cancer has 2.9 times as many recruiting interventional studies as cardiovascular disease (4,921 vs. 1,677), although heart disease caused more U.S. deaths in 2024.
- 21.6% of Phase 2 studies that ended were terminated early, against 14.5% overall.
- Oncology runs 4.9 Phase 2 studies for every Phase 3.
- Only 16.5% of recruiting studies accept children; in cardiovascular studies, 8.7%.
- Academic centers, hospitals and nonprofits lead 71% of recruiting U.S. studies.
- NIH-led study starts fell 63.5% from 2010 to 2025.
- U.S. study starts are up 3.3% in 2026 over the same dates in 2025, the first rise since 2021.
Tables and figures may be reproduced with credit and a link to this page.
Cite this research: Cottell, A. (2026). The State of U.S. Clinical Trials: 2026 Landscape Intelligence. Endrew. https://endrew.co/state-of-us-clinical-trials-2026/
About This Research
In November 2026, Endrew analyzed every study on ClinicalTrials.gov with at least one site in the United States, using its own certified data pipeline. Every figure comes from a single snapshot: ClinicalTrials.gov data as of Nov 6, 2026, loaded and certified on Nov 8, 2026 after automated checks that block publication when counts do not reconcile.

How the data moves from ClinicalTrials.gov to this report. A failure at either quality gate stops certification.
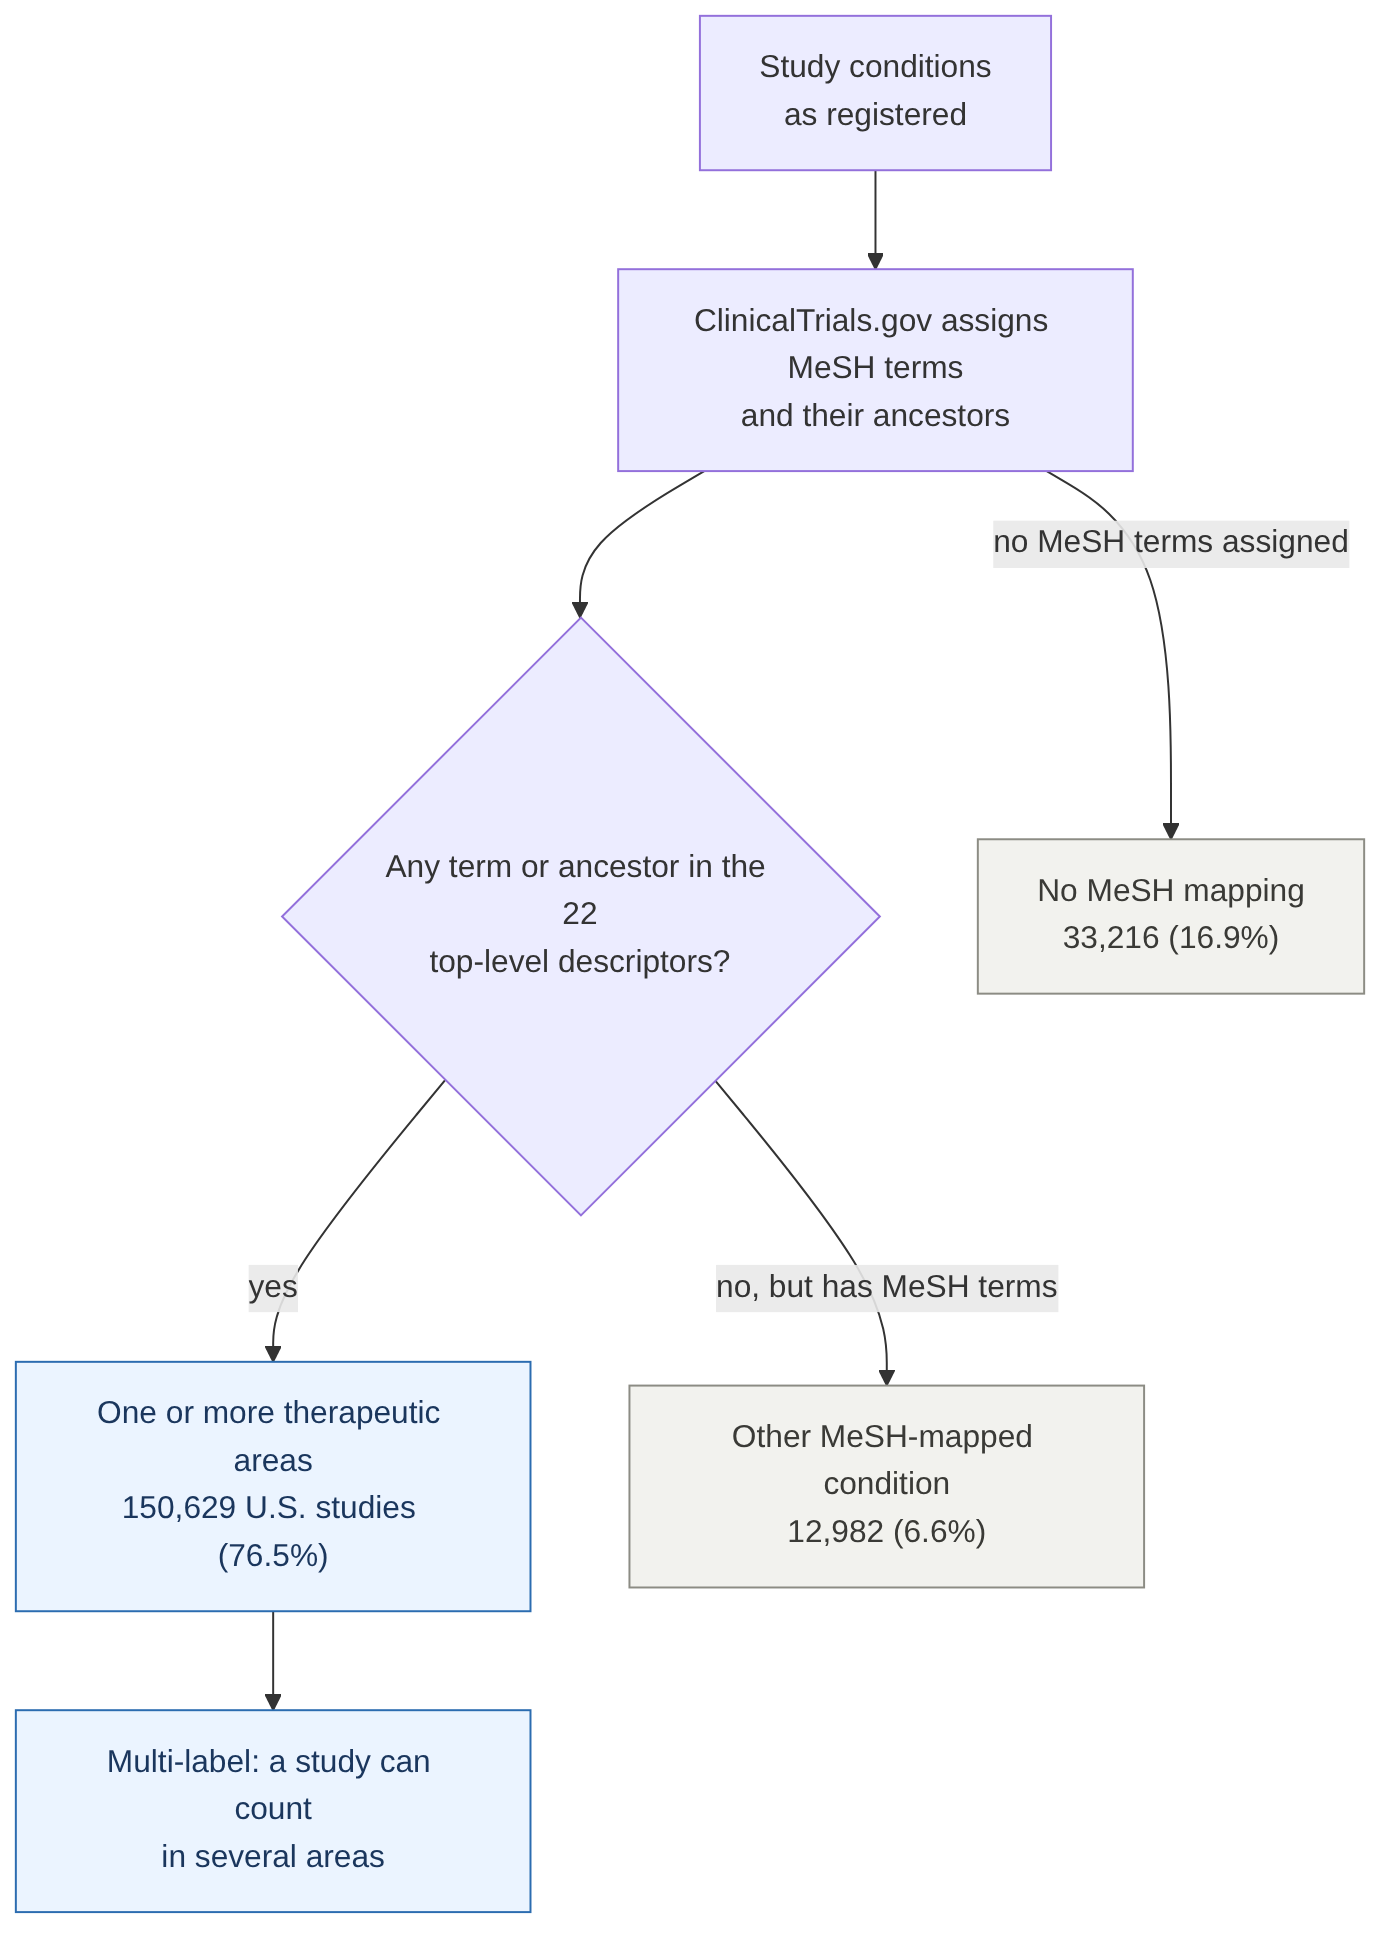
How studies are assigned to therapeutic areas. 76.5% of U.S.-linked studies map to at least one area.
- Registered studies, not patients or spending. Counts are distinct studies (NCT IDs), not sites, participants or dollars. A study in several areas or states counts once in each.
- U.S. studies. A study is included if at least one site lists the United States as its country. Multinational studies are included; U.S. territories, which ClinicalTrials.gov records as separate countries, are not.
- Therapeutic areas. Assigned from ClinicalTrials.gov’s MeSH terms for each study’s conditions and their broader terms, mapped to 22 top-level MeSH descriptors.
- Phases. Combined phases such as Phase 1/2 count in the higher phase.
- Early termination. Terminated studies as a share of studies that either completed or were terminated.
- Start dates. Many studies give only a month, so they are dated to the first of that month. Starts dated after Nov 6, 2026 are planned and excluded. Recent years can rise slightly as late registrations arrive.
- NIH-led. An NIH institute is the registered lead sponsor. This does not measure NIH funding.
- Benchmark. Our count of recruiting U.S. studies (22,051) is within 10 of an independent count published by Bond Health for Sept 21, 2026. The snapshot dates differ, so we treat this as a benchmark, not a validation.
Detailed methodology and study-level data are available to clients and verified press on request.
Sources: ClinicalTrials.gov · CDC FastStats: Leading Causes of Death · NLM Medical Subject Headings (MeSH) · Bond Health, State of Trial Enrollment 2026
© 2026 Endrew. Independent research. Not affiliated with any sponsor, institution or company named.
Disqus comments are disabled.